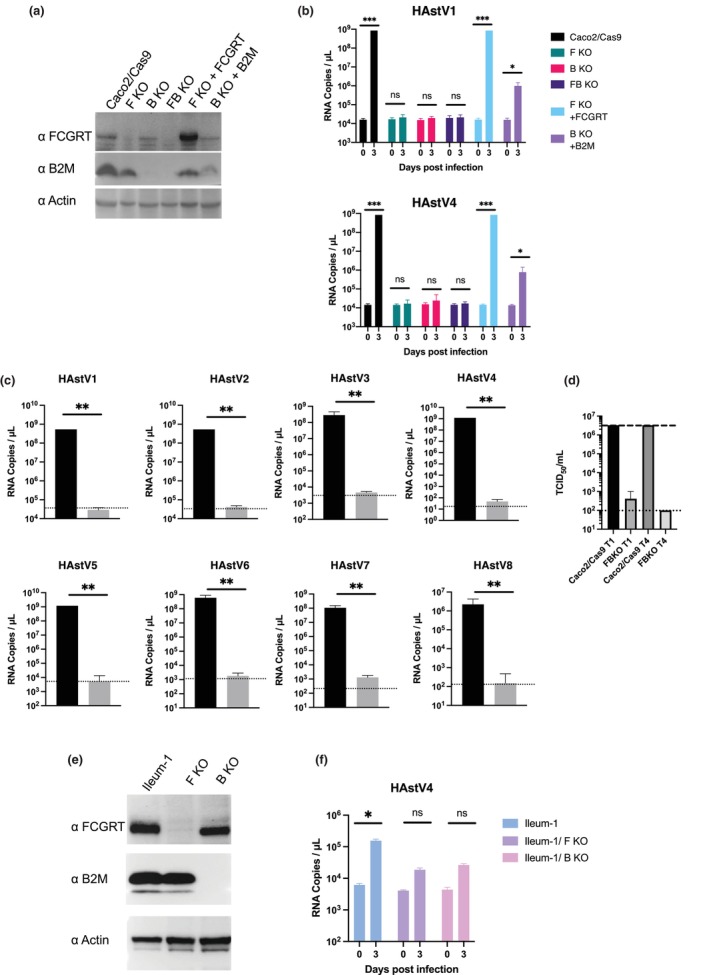
FIGURE 2.

Knocking out FCGRT or B2M prevents human astrovirus infection of Caco2 cells and an ileum‐derived human intestinal organoid (Ileum‐1). (a) Detection of FCGRT and B2M in Caco2 cells. Caco2/Cas9 knockout cells targeted for FCGRT (F KO), B2M (B KO), and both (FB KO), and cells rescued for FCGRT (F KO + FCGRT) and for B2M (B KO + B2M) were detected for FCGRT and B2M by Western blot. Actin was used as a loading control. (b) Knockout of FCGRT or B2M inhibited HAstV infection in Caco2/Cas9 cells. The cells were incubated with HAstV1 or 4 (MOI 0.05) for 1 h, washed twice, and incubated in a fresh medium containing 5 μg/ml trypsin. Culture supernatants were collected immediately after adding fresh medium (Day 0) and at 3 days post‐infection (day 3). RNA copies in the culture supernatant were determined via qPCR. Each data bar represents the geometric mean for eight wells of inoculated cells. Error bars denote SD. Each experiment was performed three times, and representative data are shown in this figure. Significance was determined by the Mann–Whitney test (***p < 0.0005; *p < 0.05; ns, not significant). (c) Knocking out FCGRT and B2M (FB KO) inhibited infection by all serotypes of classical HAstV (Mammastrovirus 1) in Caco2/Cas9 cells. Caco2/Cas9 (black) or FB KO Caco2 (gray) cells were incubated in a culture medium containing trypsin‐activated HAstV for 1 h. After washing with the medium three times, the cells were cultured with 5 μg/ml trypsin for 3 days at 37°C. The amount of genomic RNA of each virus was determined by qPCR. Each data bar represents the geometric mean for eight wells of inoculated cells. Error bars denote SD. Each experiment was performed two or more times, and representative data are shown in this figure. Significance was determined by the Mann–Whitney test (**p < 0.005). (d) The median tissue culture infectious dose (TCID50) of progeny virus of HAstV1 (T1) or HAstV4 (T4) produced from Caco2/Cas9 and FB KO cells at 3 days post‐inoculation was determined. Each data bar represents the geometric mean for six wells of Caco2/Cas9 or FBKO cells. Error bars denote SD. The dashed or dotted line indicates the upper or lower limit of TCID50. (E) Detection of FCGRT and B2M in corresponding knockout Ileum‐1 cells. Actin was used as a loading control. (F) Each gene‐knockout Ileum‐1 monolayer was inoculated with culture medium containing trypsin‐activated HAstV4. After washing twice with basal culture medium, cells were cultured at 37°C for 3 days. Genomic RNA copies of each virus were determined by qPCR. Each data bar represents the geometric mean for four wells of inoculated monolayers. Error bars denote genomic SD. Each experiment was performed twice, and representative data are shown in this figure. Significance was determined by the Mann–Whitney test (*p < 0.05; ns, not significant).
