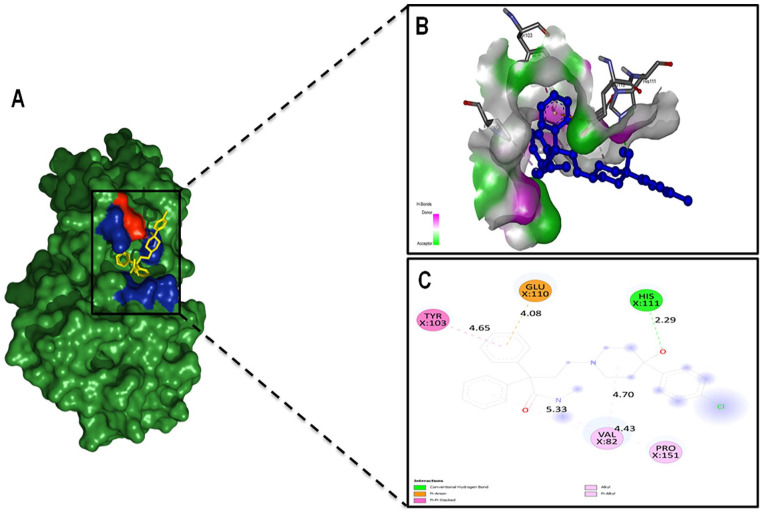
Figure 10.
Molecular docking analysis showing the best pose of HP with Loperamide. (A) Protein-ligand interaction with surface representation. Red and blue color surrounding to ligand (yellow) depicted polar and non-polar residues, respectively. (B) An enhanced 3D illustration showed ligand-binding pocket. (C) 2D image showing interactions between receptor and substrate via one conventional hydrogen bond distancing 2.29 Å and two Pi-Alkyl bonds. A single pi-anion and a pi-pi stacked found interacting with a benzene ring of Loperamide.

