FIGURE 1.

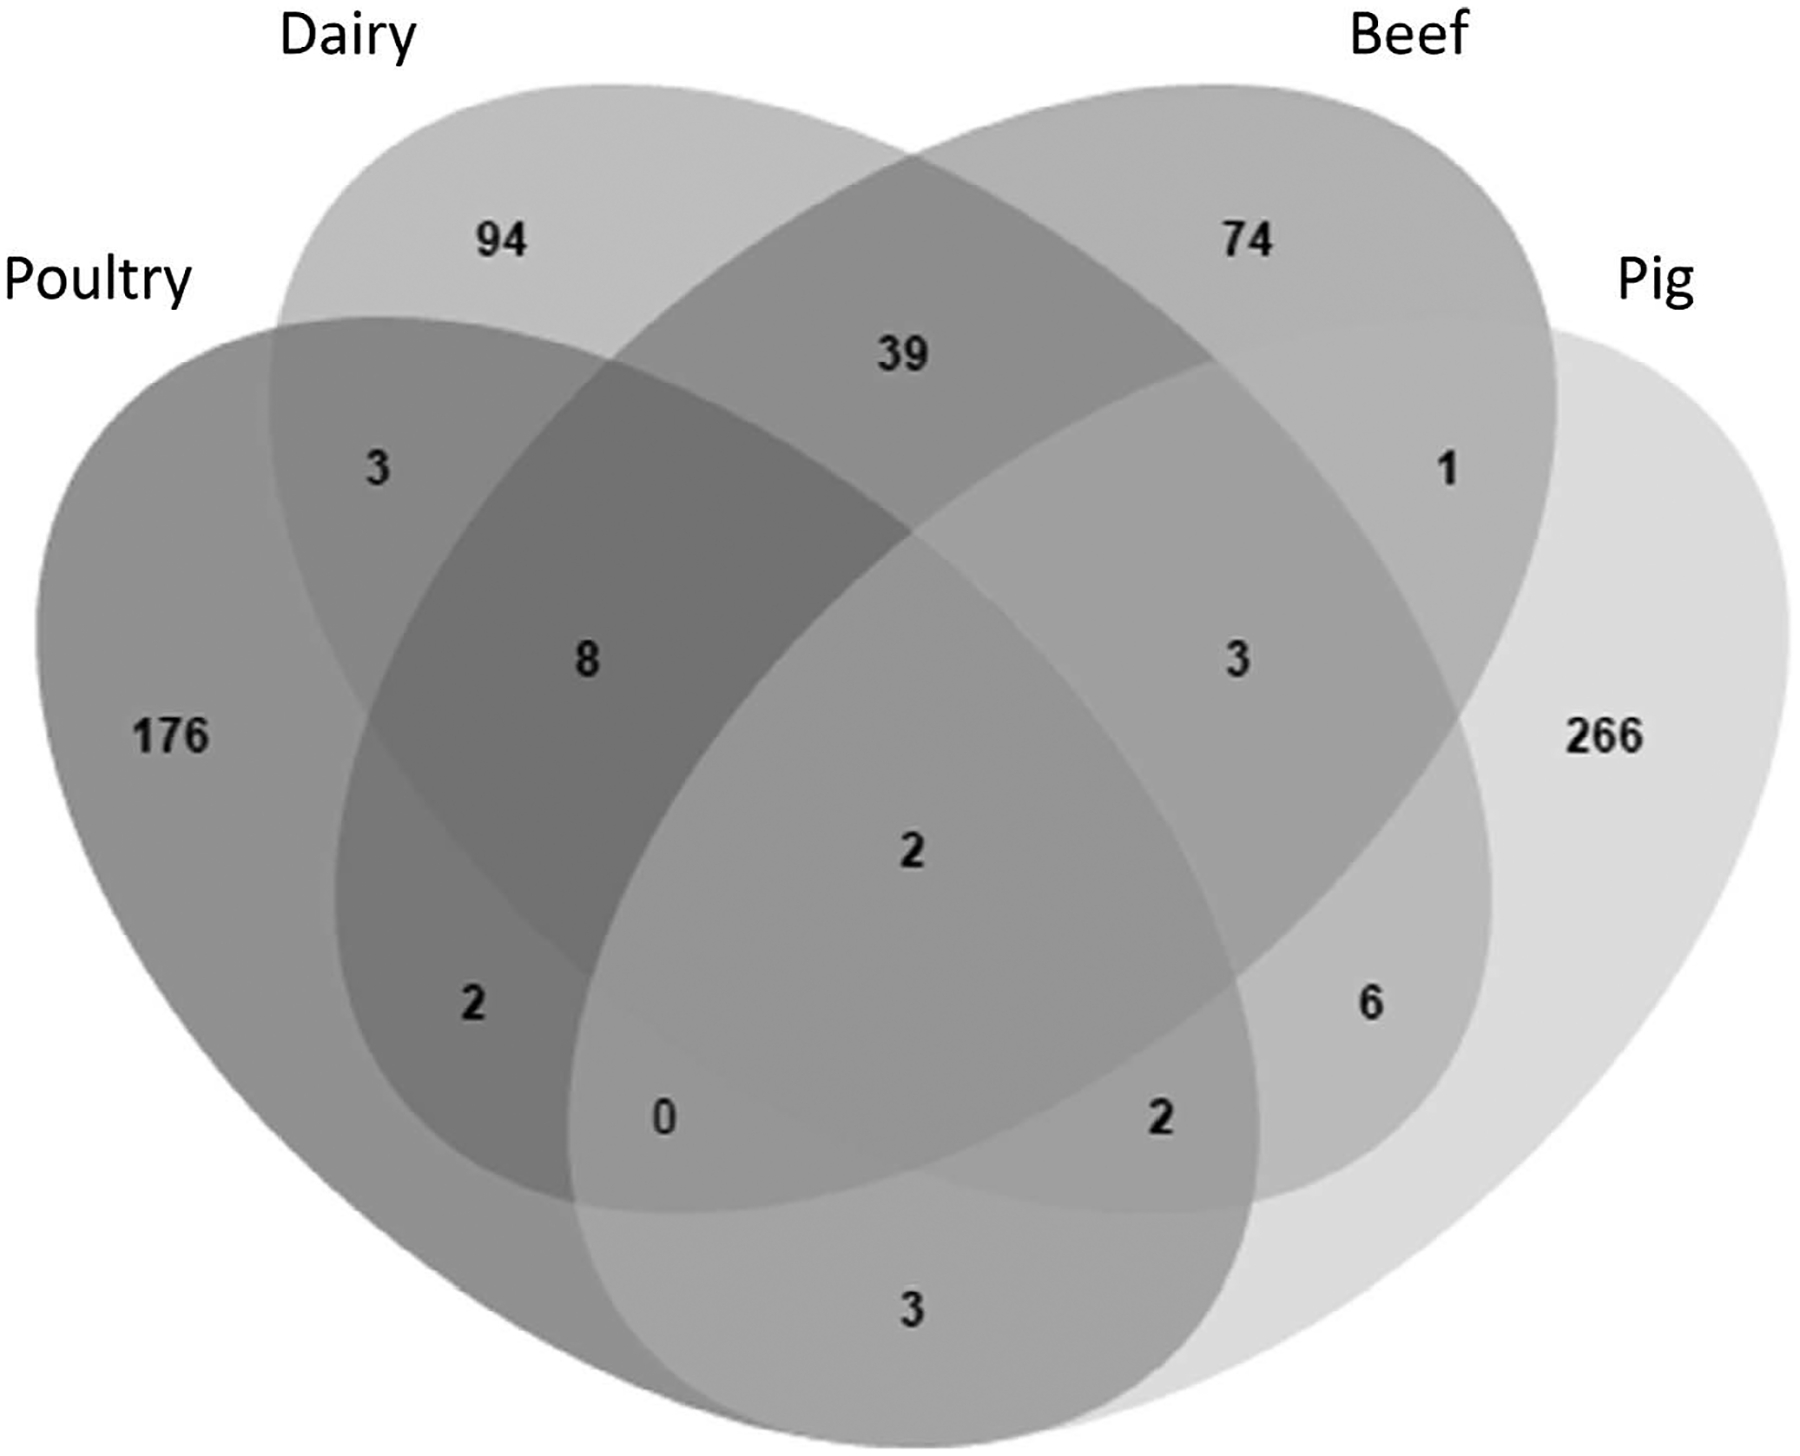
Diversity of PFGE patterns by source. The Venn diagram depicts the number of PFGE patterns that are unique and shared among sources. Poultry refers to patterns of isolates from both poultry animals and poultry retail meat.

Diversity of PFGE patterns by source. The Venn diagram depicts the number of PFGE patterns that are unique and shared among sources. Poultry refers to patterns of isolates from both poultry animals and poultry retail meat.