
FIG. 2.
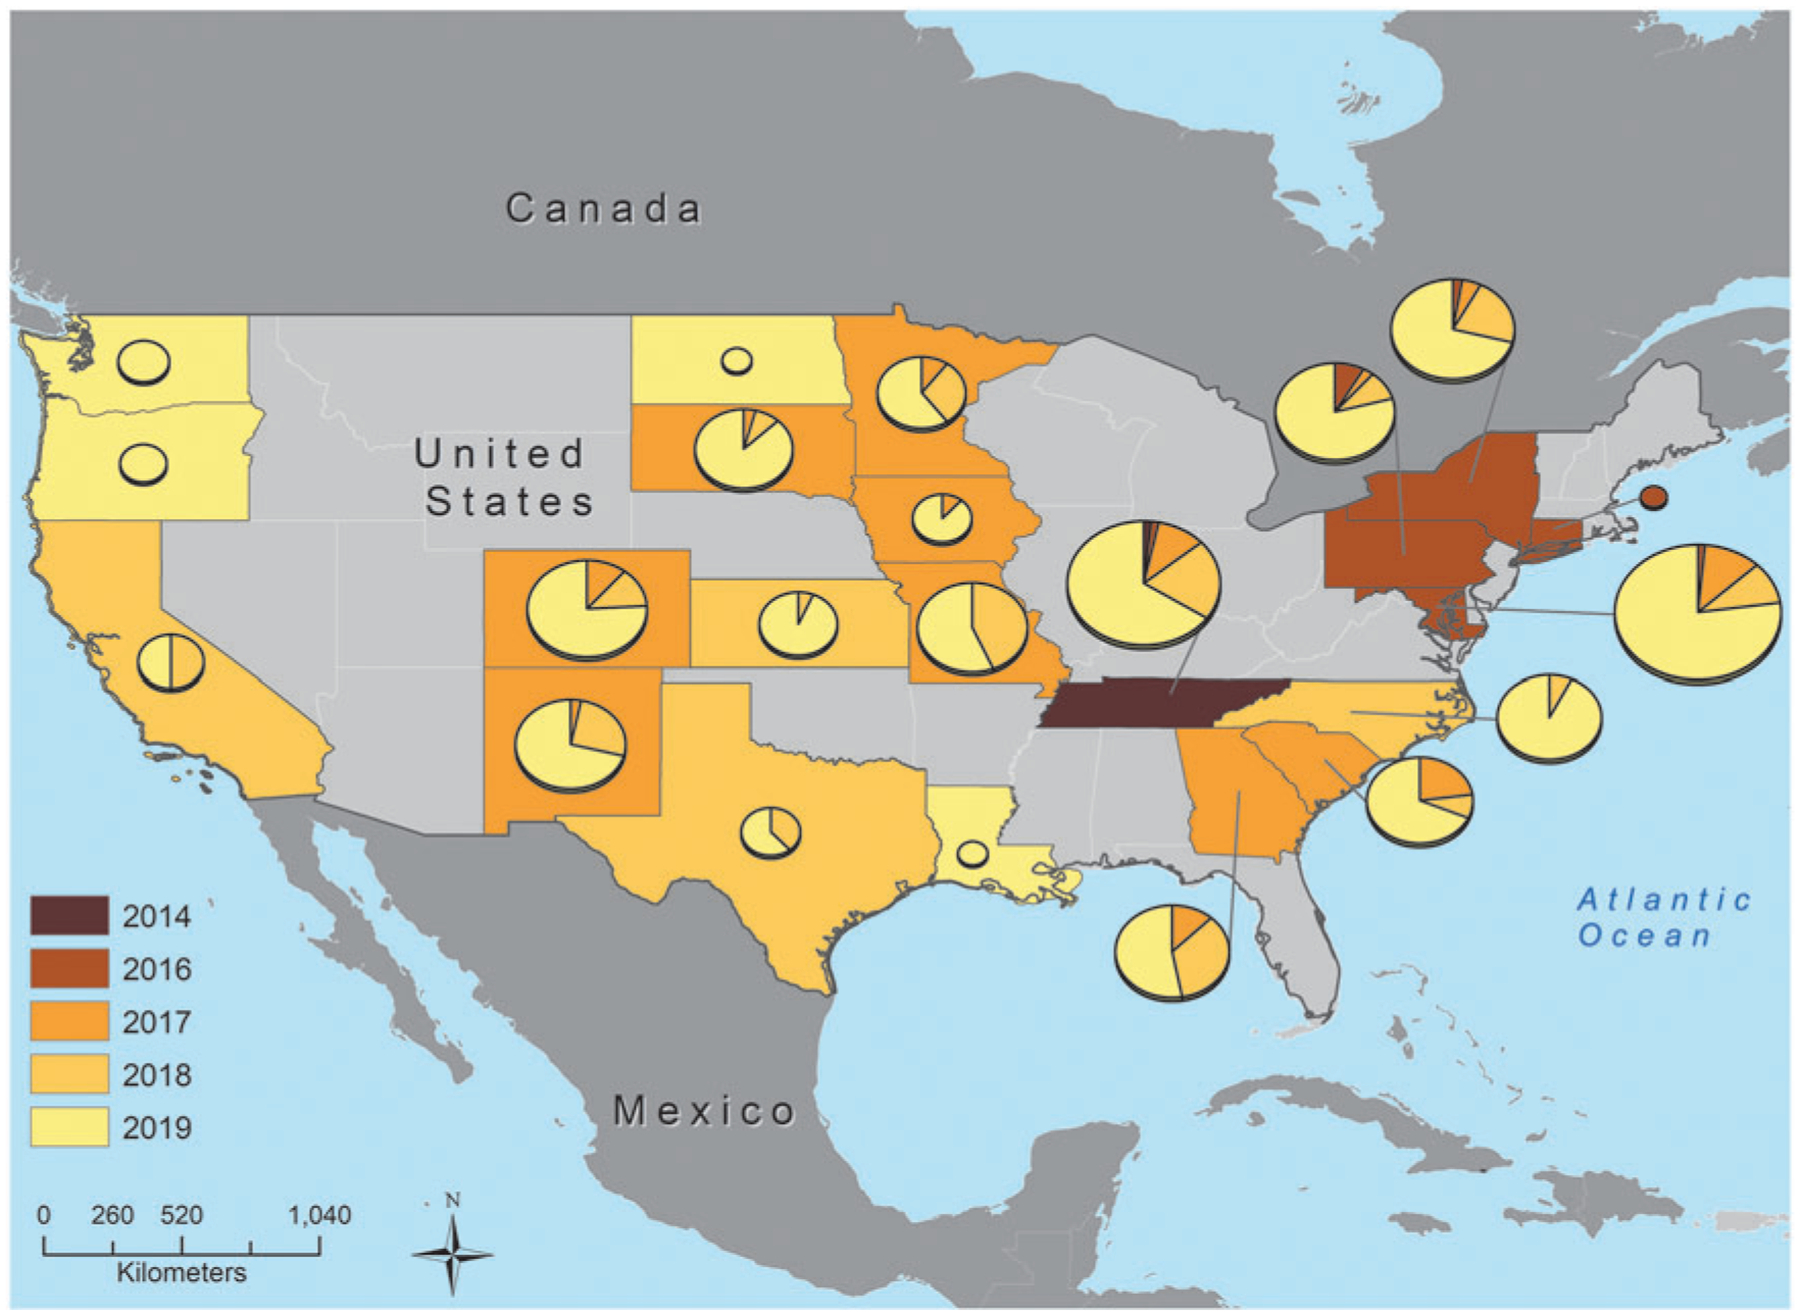
Geographic representation of ESI clone emergence. States are colored by the year the clone was first identified in retail meats, with pie charts representing the proportion of isolates from each year. The size of the pie chart is proportional to the number of isolates from each state. Note: not all states were part of surveillance for all years of this study, and states colored gray are not part of NARMS surveillance.