Figure 5:

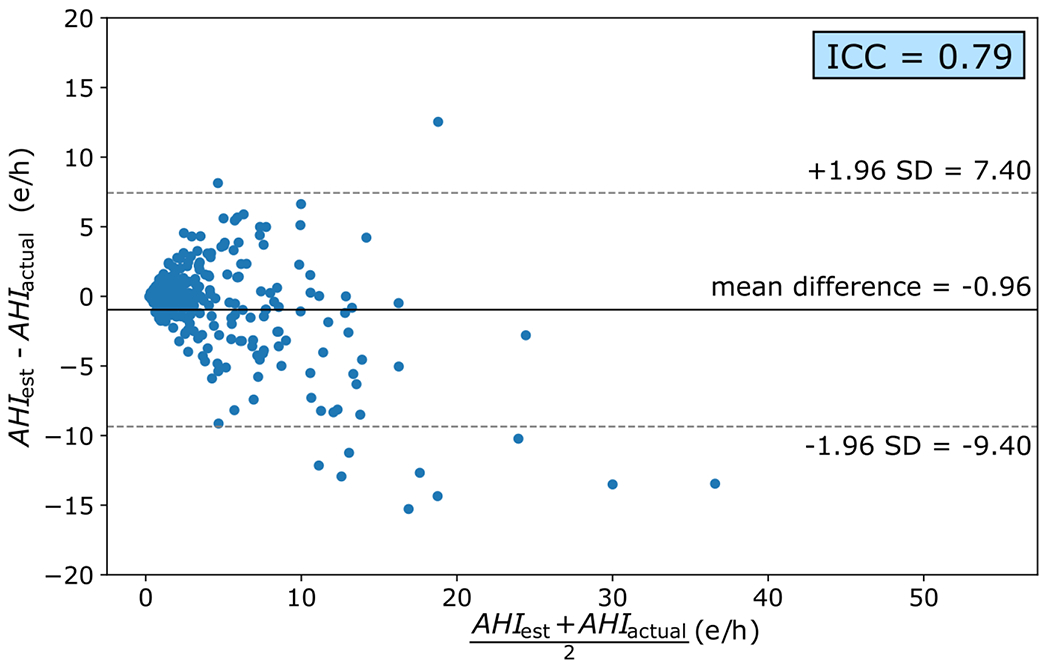
Bland-Altman plot and ICC value calculated from the AHI estimated by our model and the AHI extracted from PSG in the CHAT database. SD (standard deviation); e/h (events/hour).

Bland-Altman plot and ICC value calculated from the AHI estimated by our model and the AHI extracted from PSG in the CHAT database. SD (standard deviation); e/h (events/hour).