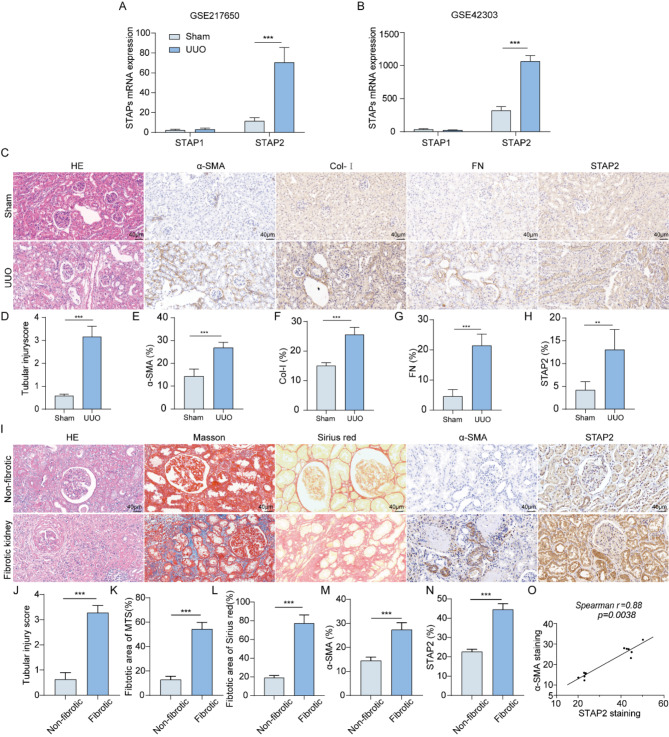
Fig. 1.
STAP2 is significantly upregulated in fibrotic kidney. (A-B) Relative STAP1 and STAP2 mRNA levels in GSE217650 (A) and GSE42303 (B), respectively. (C-H) Representative micrographs (C) and quantification of HE (D), α-smooth muscle actin (α-SMA) (E), Col-I (F), FN (G) and STAP-2 (H) in sham and 7-day UUO mice. Magnification, 400×. Scale bar, 40 μm. n = 6 mice. (I-N) Representative micrographs (I) and quantitative analysis of HE (J), Masson’s staining (K), Sirius red staining (L), α-SMA (M) and STAP-2 (N) in human non-fibrotic and fibrotic kidney. Magnification, 400×. Scale bar, 40 μm. n = 6 patients. (O) Correlation between STAP2 expression level and the degree of α-SMA staining in all patients (n = 8). Error bars represent mean ± SEM. The comparable analysis of two groups was performed through two-tailed unpaired Student’s t-test. **p < 0.01, ***p < 0.001

