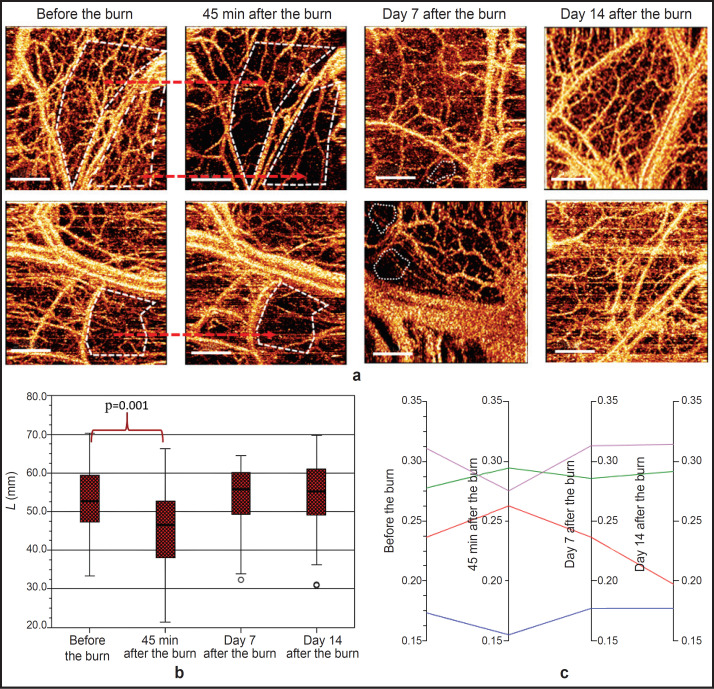
Figure 2. OCTA data demonstrating microcirculatory changes in the colon in different time periods after thermal skin burn modeling:
(a) dynamics of vascular network changes in OCTA images in different time periods after thermal burn induction as compared to the blood vessel imaging before the burn. In 45 min after burn induction, vessel-free areas appear in OCTA images (marked by a white dashed line), on days 7 and 14, the angiographic picture is restored; red arrows — the regions of OCTA images with specific changes in the vascular bed before and after the burn; bar 1 — mm;
(b) dynamics of median values of the total blood vessel length before the burn, 45 min after it, on days 7 and 14 after the induction of the thermal skin burn;
(c) dynamics of the proportion of blood vessels of a certain diameter in the overall functioning vascular network: blue line — L1 (d≤15 μm); violet — L2 (d=16–60 μm); green — L3 (d=60–100 μm); red — L4 (d>100 μm)

