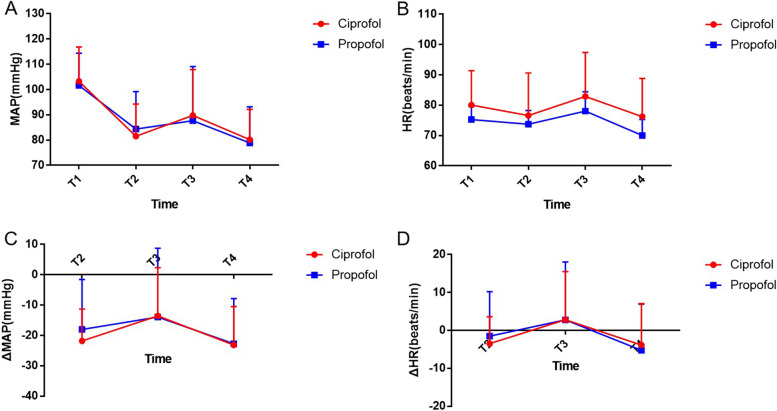
Fig. 2.
Variations in heart rate and blood pressure during anesthesia induction. Error bars represent the standard error of the mean (SEM). T1: before induction of anesthesia; T2: before tracheal intubation; T3: 1 min after tracheal intubation; T4: 5 min after tracheal intubation. ΔMAP: the difference in mean arterial pressure (MAP) calculated as the pressure at each time point minus the baseline pressure (T1). A negative ΔMAP indicates a drop in pressure, while a positive ΔMAP indicates an increase. ΔHR: the difference between the heart rate at each time point and the baseline heart rate. A Mean arterial pressure (MAP) at different time points during anesthesia induction. B Heart rate at different time points during anesthesia induction. C ΔMAP at different time points during anesthesia induction. D ΔHR at different time points during anesthesia induction

