Fig. 7.
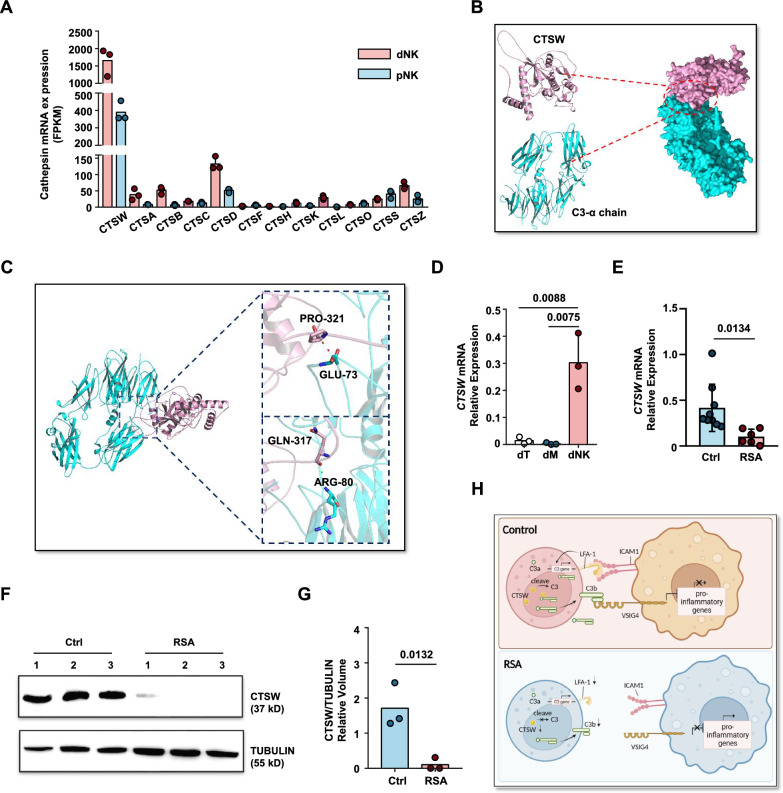
C3 cleavage potential of cathepsin W. A FPKM values of cathepsin family genes in pNK cells and dNK cell RNA-seq data. B Schematic representation of the interaction between CTSW protein and C3 α-chain protein. C Schematic enlargement of the binding site between CTSW protein and C3 α-chain protein as simulated by ZDOCK. D Gene expression levels of CTSW in the three major immune cell subtypes of the decidua: NK cells, macrophages, and T cells. E Gene expression levels of CTSW in decidua NK cells from normal pregnancy and RSA patients. F Western blot analysis of CTSW protein expression in decidua NK cells from normal pregnancy and RSA patients, TUBULIN expression was measured as loading control. Experiments were repeated for 2 independent times. G Relative volume quantification of CTSW protein and the loading control protein TUBULIN using ImageLab software. H Graphic abstract of this article. Created with BioRender.com

