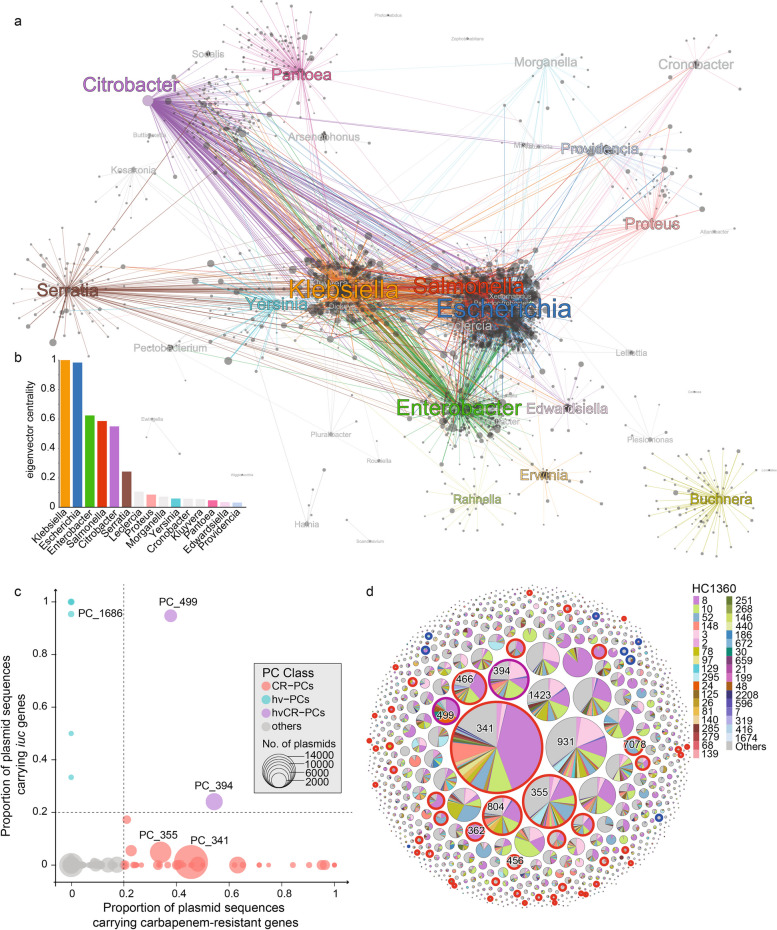
Fig. 2.
The host association and genetic characteristics of the PCs. a A graph of the plasmid-exchange network in Enterobacteriaceae. Nodes show the plasmids (gray pots) and genera of the hosts (colored) and the colored edges show the presence of the plasmids in the corresponding hosts. b Histogram of the eigenvector centralities of genera in the network in part a. c Scatter plot of the average carriage of carbapenemase genes (X-axis) and the iuc gene (Y-axis) in each PC. Each circle represents a PC and is sized proportional to the number of associated plasmids and color-coded as in the Key. The two dashed lines show the criteria for assigning PCs as CR-PCs (≥ 0.2 carbapenemases), hvPCs (≥ 0.2 iuc), or hvCR-PCs. d Bubble plot of the HC1360 distribution for each PC. Each bubble indicates a PC and is sized relative to the associated plasmids. The piechart in each bubble shows the proportional presence of the PC in different HC1360s. The halos surrounding some bubbles indicate that these PCs belong to one of the CR-PCs (red), hvPCs (blue), or hvCR-PCs (purple), as defined in part c

