Fig. 3.
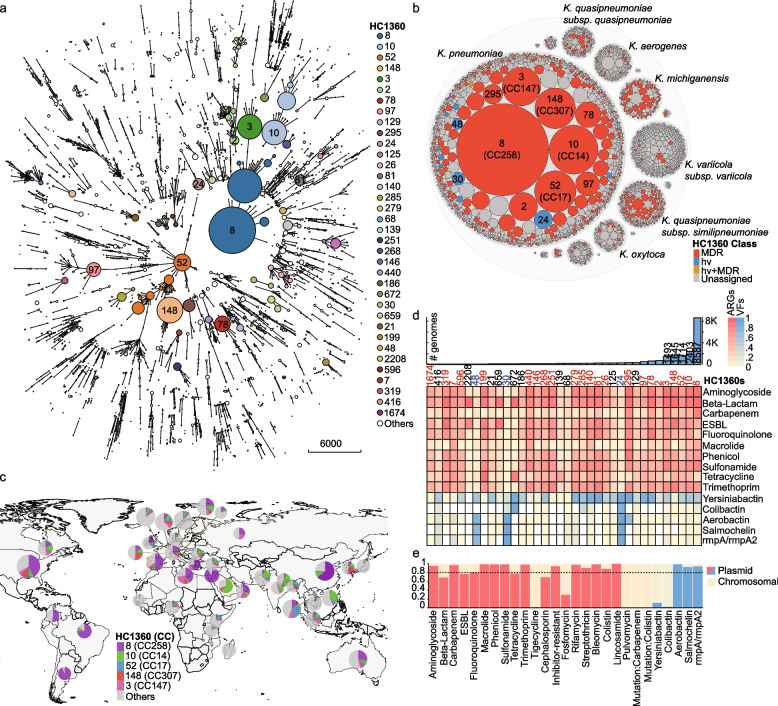
The population structure and geographical distribution of the Klebsiella genomes. a A minimum spanning tree of 33,272 Klebsiella genomes based on their dcgMLST profiles. Branches with < 400 allelic distances are collapsed. The HC1360 populations with ≥ 100 genomes are color-coded as in the Key and some are also labeled. Only branches with < 3035 allelic distances are shown by clarity. b Hierarchical bubble plot for the population structure of the Klebsiella genus. The bubbles indicate the genus, species, and HC1360 populations in Klebsiella. Some HC1360s are color-coded because the majority of the genomes in them are MDR (red), hypervirulence (blue), or both (orange). c Global distribution of the five major HC1360 populations in countries with ≥ 1000 genomes visualized using D3.js. d The heat plot of the prevalence of antimicrobial-resistant genes (ARGs; red) and hypervirulence factors (VFs; blue) in the top 36 HC1360 populations. The histogram on the top shows the numbers of genomes in the HC1360 populations. e The predicted percentages of each of the ARGs and VFs from the plasmids. The dotted line indicates 80% of plasmid origins

