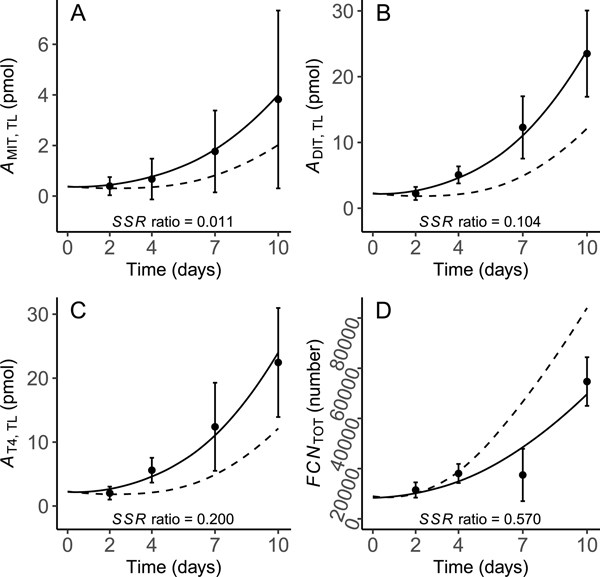
Fig. 4.
Predicted and measured precursors of MIT (A), DIT (B) and T4 (C), and follicular cell/thyrocyte numbers (D) in the thyroid gland of X. laevis larvae. Model predictions were obtained under control conditions (solid line) and when TPO activity was arbitrarily inhibited by 95% (dashed line). Solid points (mean ± SD) represent control datasets [21] used for model calibration. The sum of squared residuals (SSR) ratio indicates the proportional contribution of each endpoint to the overall model cost under control conditions. A — amount; MIT — monoiodotyrosine; DIT — diiodotyrosine; T4 — thyroxine; TL — thyroid lumen; FCN — follicular cell number; TOT — total.

