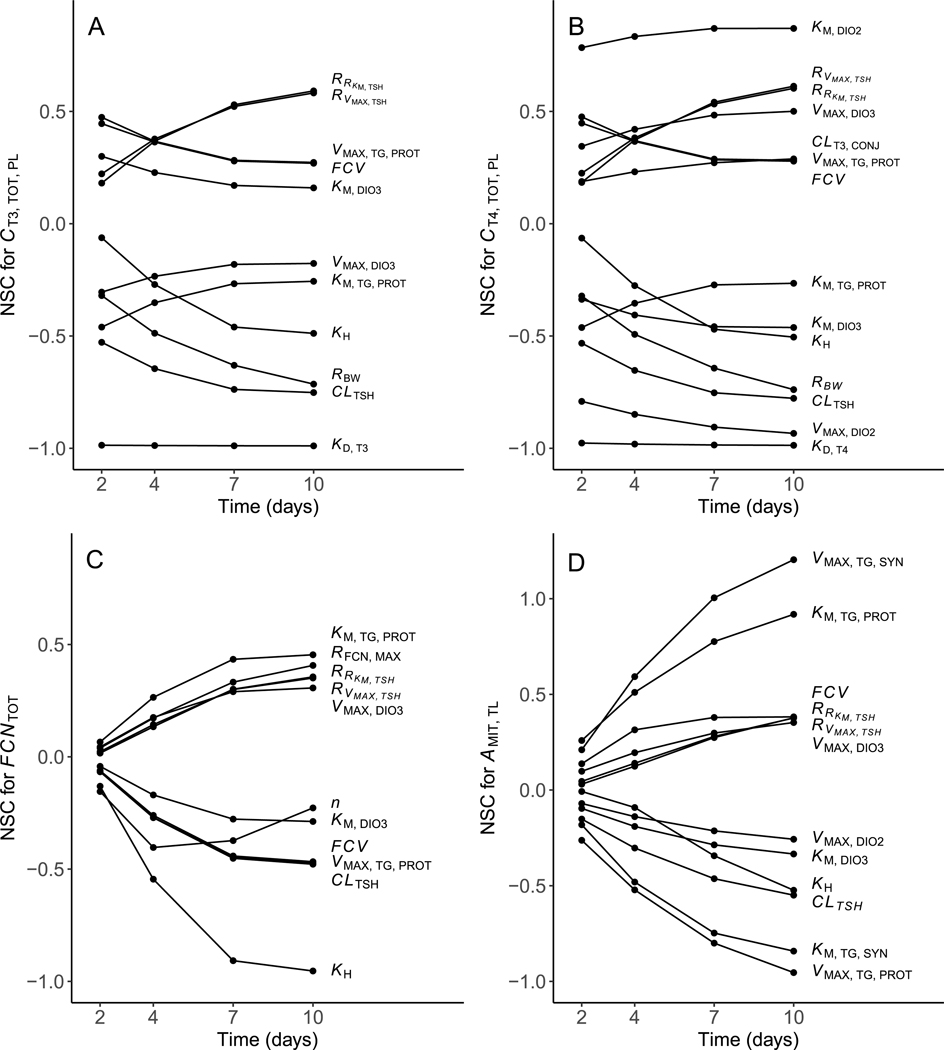
Fig. 6.
Normalized sensitivity coefficients (NSC) over four modeled time points (2, 4, 7, and 10 d) for: (A) total plasma T3 concentration, (B) total plasma T4 concentration, (C) total follicular cell (thyrocyte) number, and (D) the amount of MIT in the thyroid lumen. Only parameters showing NSCs in any of the four time points are displayed. Parameters with NSCs in all timepoints and for all variables were removed for the sake of clarity. Please see text and Table 1 for definitions of abbreviations.

