Fig. 1.
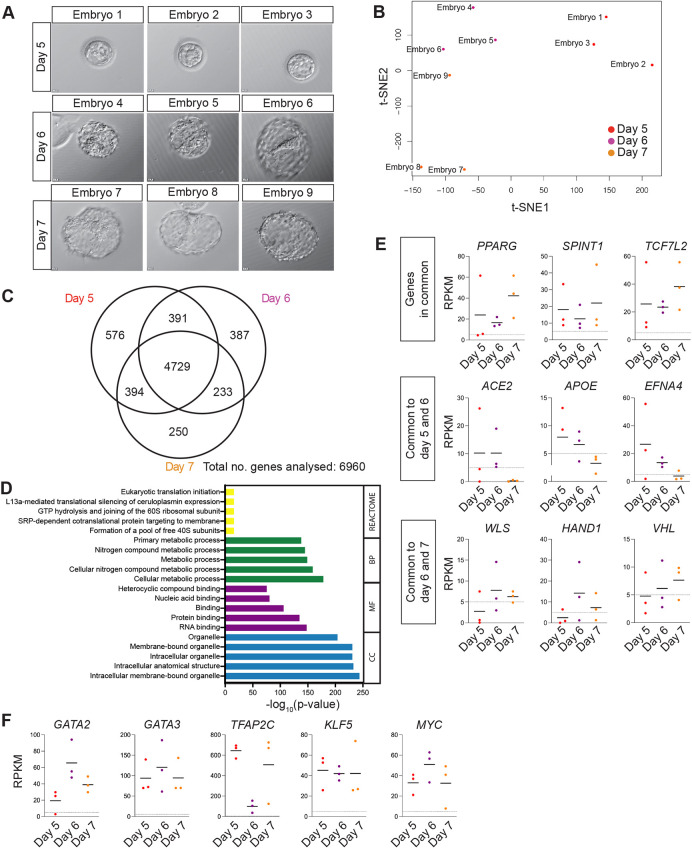
Transcriptome analysis of TE in human blastocysts. (A) Brightfield images of human blastocysts microdissected for TE isolation ahead of RNA-sequencing analysis. (B) t-distributed stochastic neighbour embedding (t-SNE) plot based on VST-normalisation of the top 6000 most variable expressed genes. A colour-coded sample key is provided. (C) Venn diagram indicating the number of transcripts with overlap or unique expression at day 5, day 6 and day 7 in the mural TE (RPKM>5). (D) The genes identified as expressed in common for day 5, 6 and 7 were used to perform Gene Ontology and REACTOME functional enrichment analyses; the most enriched terms for the categories biological process (BP), cellular component (CC), and molecular function (MF) as well as REACTOME pathways are shown. (E) Scatterplots showing selected genes that are expressed in common at all stages analysed, expressed in common at days 5 and 6, or expressed in common at days 6 and 7. Horizontal line denotes the mean RPKM value of each time point; dotted line shows RPKM value=5. (F) Scatterplots showing expression of GATA2, GATA3, TFAP2C, KLF5 and MYC at days 5, 6 and 7. Horizontal line denotes the mean RPKM value of each time point; dotted line shows RPKM value=5.

