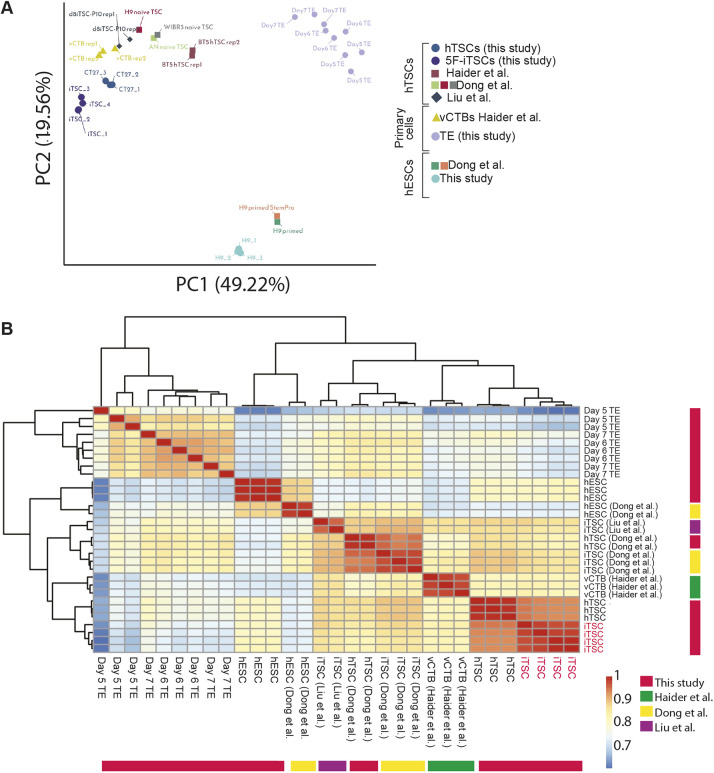
Fig. 5.
Global transcriptional analysis of 5F-iTSCs and similarity to previously established TSCs. Analysis of mRNA-derived 5F-iTSCs (this study), previously established hTSCs (CT27, BTS5) (Okae et al., 2018), iTSCs derived from naïve transdifferentiation experiments (Liu et al., 2020; Dong et al., 2020), primary placental CTBs (Haider et al., 2018) and primed hESCs (this study) (Dong et al., 2020). (A) PCA using the top 500 most variable expressed genes. (B) Unsupervised hierarchical clustering of the samples. Spearman's rank correlation coefficient was plotted on a high-to-low scale (red-yellow-blue). 5F-iTSCs generated in this study are labelled in red on the outer bars.

