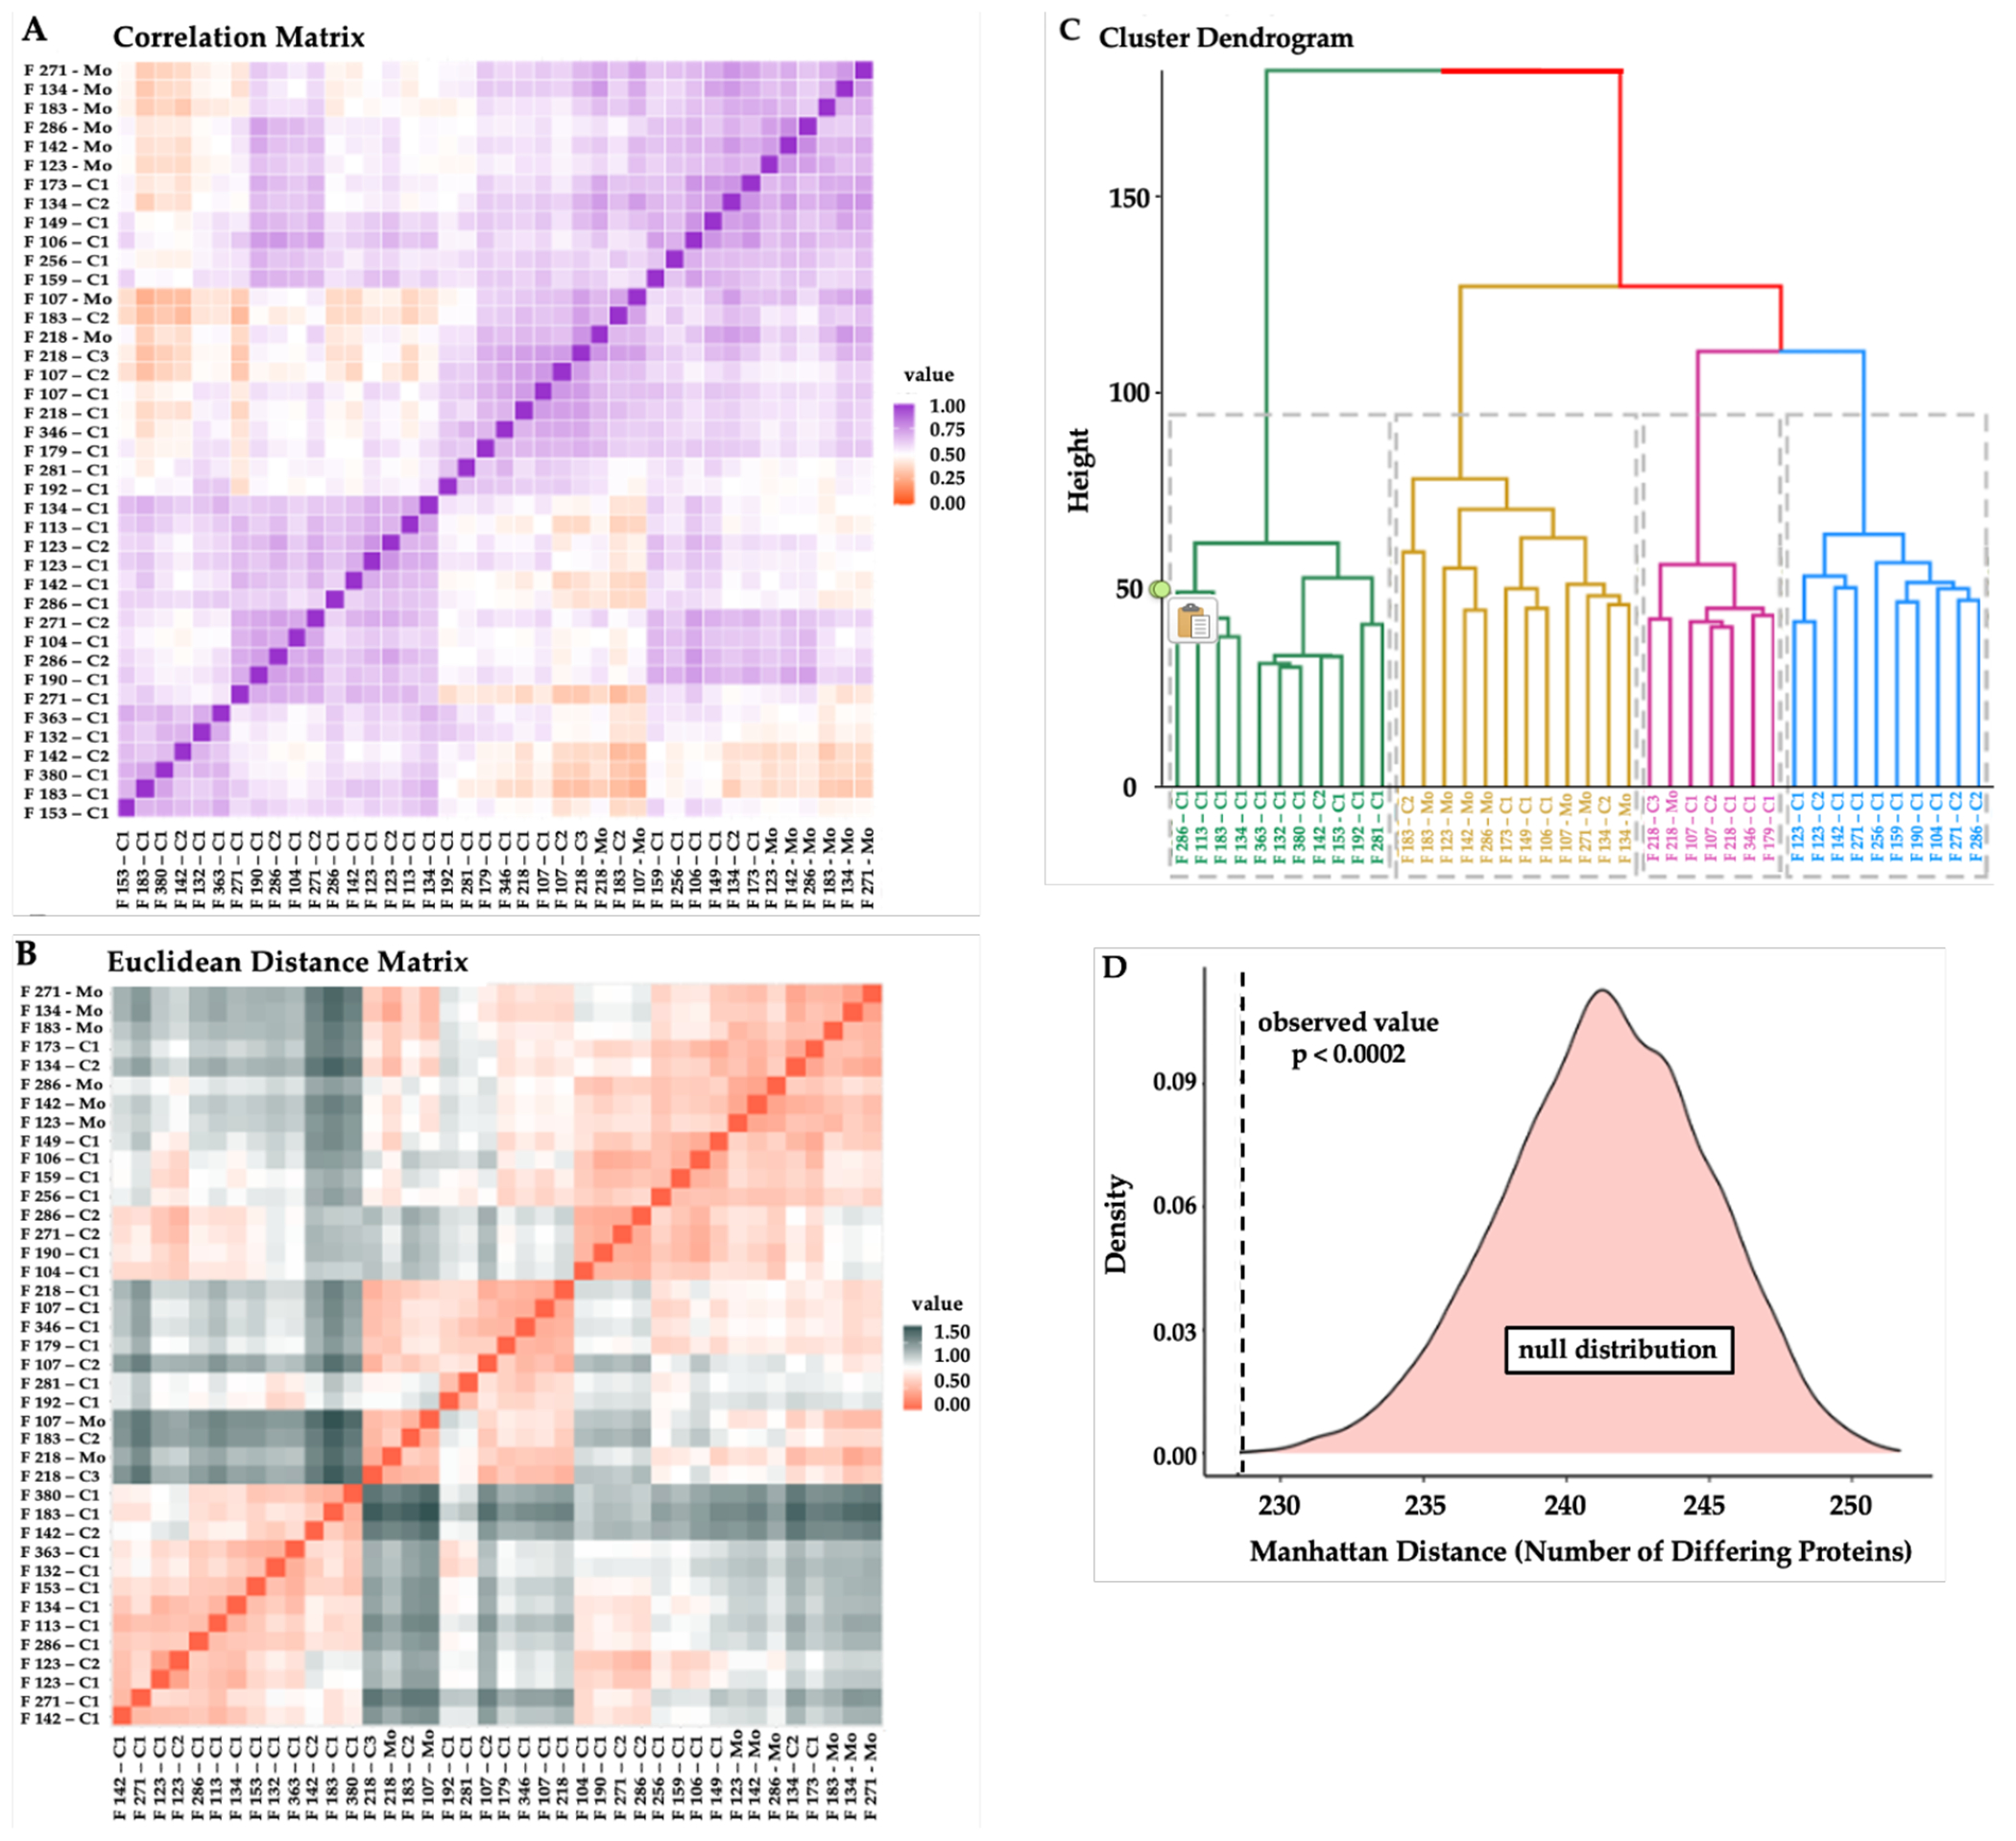
Figure 2. Similarities in Hair Protein Profiles of Individuals and Families.

Note. (A) Spearman rank correlation matrix, with high (purple) to low (orange) correlation coefficients*; (B) Euclidean distances based on protein spectral counts, showing individuals more closely related (red) or more distant (grey) from each other*; (C) Hierarchical cluster dendrogram based on log spectral counts showing 7/8 mothers grouped in one cluster (mustard) with one mother in an adjacent cluster (pink); younger children (0-2 years) in one cluster (green) whereas older children dispersed in the other clusters*; (D) Intra-family Manhattan distances from Boolean hair protein profiles were shorter in mothers matched with their own children (p<0.0002) vs. 5000 simulated datasets created with mismatched mothers and children.
*Individuals are listed on the X- and Y-axes with their family identifier, with Mo for mother, C1 for the younger child, and C2 for the older child in each family.
