
FIGURE 7.
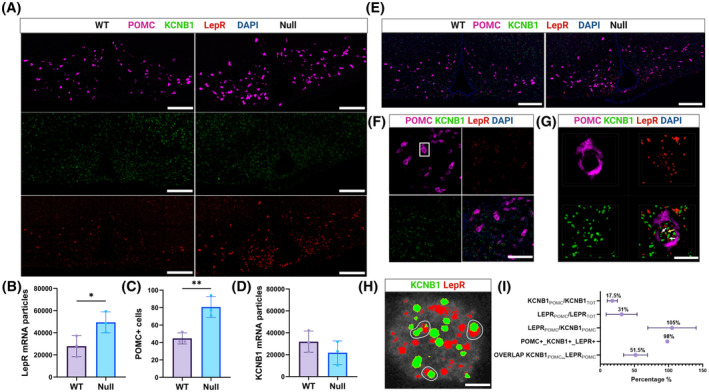
In situ hybridization reveals the presence of KCNB1 and LepR mRNA in POMC neurons. (A) Representative confocal images of brain slices showing the hypothalamus of WT and NULL hybridized with fluorescent probes for POMC (magenta), KCNB1 (green), and the LepR (red.) Scale bars 1 mm. (B) Mean number of LepR mRNA transcripts per image in WT and NULL slices. (C) Mean number of cells per image expressing POMC mRNA transcripts (POMC+) in WT and NULL slices. (D) Mean number of KCNB1 mRNA transcripts image in WT and NULL slices. (E) Overlap of the images in (A). Note the presence of many cells co‐expressing POMC, KCNB1, and LepR signals. Scale bars 1 mm. (F) Representative confocal images of an area of the ARH expressing POMC, KCNB1, and LepR mRNA transcripts and overlap (lower right image). The boxed area represents a single cell. Scale bars 30 μm. (G) Magnifications of the boxed area in (F), showing POMC, KCNB1, and LepR signals. The image in the lower right corner is a z‐stack of 18 images. Spots of colocalization of single KCNB1 and LepR mRNA molecules are indicated by arrows. Scale bars 10 μm. (H) Representative image of a single POMC+ cell showing individual KCNB1 and LepR mRNA molecules. Partial overlap of KCNB1 and LepR signals is indicated. (I) Percentage of KCNB1 and LepR mRNA transcripts present in POMC+ cells; percentage of POMC+ cells simultaneously expressing KCNB1 and LepR mRNA transcripts; mean ratio of single LepR and KCNB1 transcripts per POMC+ cell expressed in percent and percentage of KCNB1‐LepR mRNA transcripts partial overlaps per POMC+ cell. N = 119 cells, 3 biological replicates, and 8 technical replicates. *p < .05, **p < .01 (two‐tailed Student's t‐test).