
Figure 3.
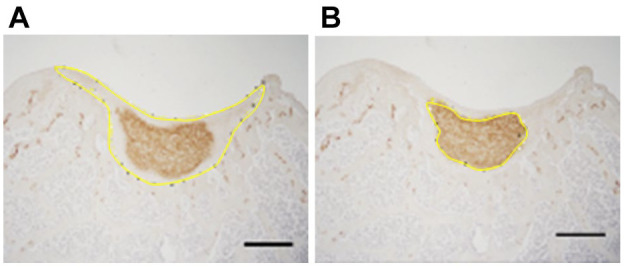
Analysis of image stained with anti-type 2 collagen antibody using Image J. The area of the entire implanted cell sheet regenerative area (A); and the positive cell area (B). % COL2 area is shown as the percentage of (B) to (A). Bars: 500 μm.