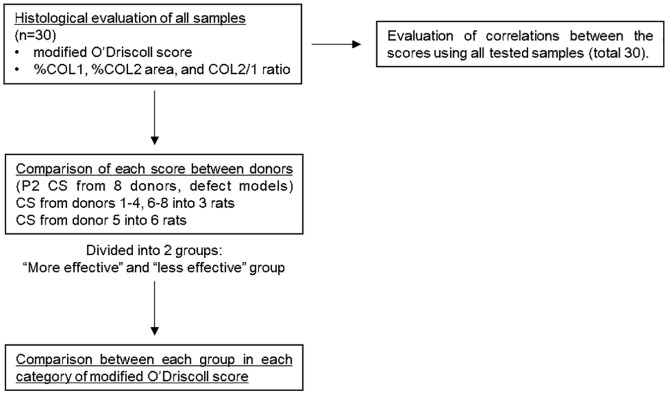
Figure 4.
Study methodology. P2 cell sheets (CS) from donors 1-4, 6-8 were transplanted into 3 rats and CS from donor 5 into 6 rats. 3 defect models were also prepared as a control. Pearson’s correlation coefficient was used to evaluate the correlations between scores. ANOVA with post hoc Tukey-Kramer testing was used to compare each score between donors and each category of modified O’Driscoll score between groups.

