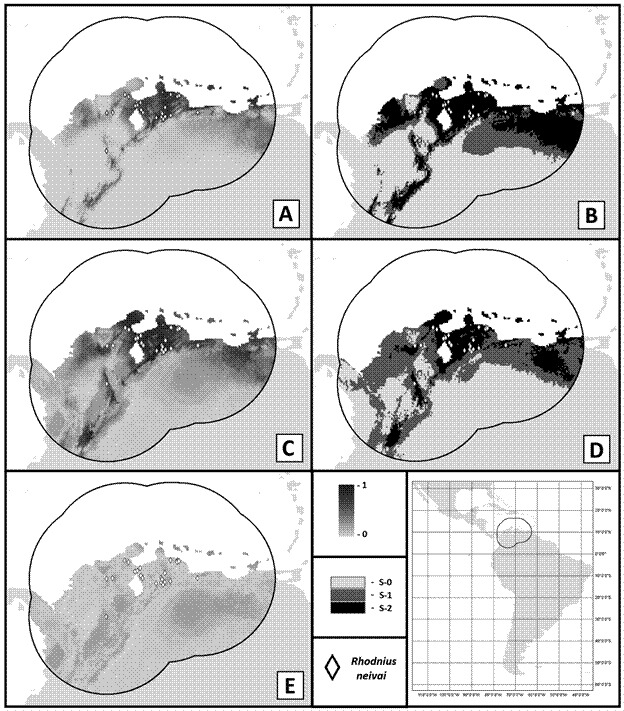
Fig. 2: ecological niche models (ENMs) for Rhodnius neivai; register for the species are indicated as a lozenge, the figure in the left-down corner indicates the neotropical region and surrounding areas, the circular area indicates the calibration area for the ENMs; note the analyses were only made for this particular geographical region. On the left column are present continuous maps with float values, ranging from zero (lighter gray) to one (darker gray). Maps in the right column are derived from the sum of binary models and present categories: S-0 (no suitability), S-1 (suitability given one scenario), and S-2 (suitability given both scenarios). (A) Three variables ENM. (B) Categorical model based on the sum of binary three variables ENMs, scenarios are based on thresholds. (C) Principal Component Analysis (PCA) variables ENM. (D) Categorical model based on the sum of binary PCA ENMs, with scenarios, based on different algorithms. (E) Standard deviation model for PCA variables ENM, based on algorithm variation.

