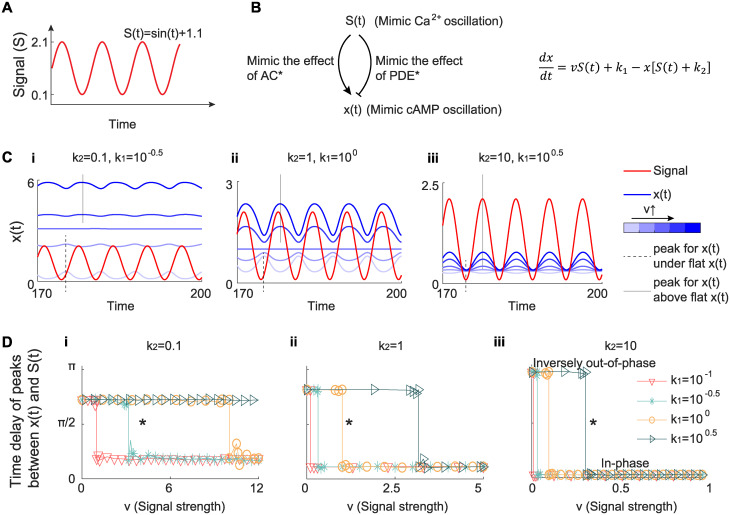
Fig 4. A simple incoherent feedforward loop explains in-phase oscillation and inversely out-of-phase oscillation.
(A) The signal used in the simple ODE model. We used a sine wave sin(t) + 1.1 as the signal S(t) to mimic the dynamics of Ca2+, where 1.1 is to ensure the positive sign of the signal. (B) Schematic of the ODE model. We constructed a simple circuit with only two regulatory links: one is the activation from the signal S(t) to the output x(t); the other is the inhibition from the signal S(t) to the output x(t). This circuit captures the positive role of Ca2+ not only in the cAMP production through active AC but also in the cAMP degradation through active PDE. The equation describing the dynamics of x(t) is shown in the right panel. (C) The dynamics of S(t) (red) and x(t) (blue) under different values of k1 and k2, and v. Values of k1 and k2 are labeled over the plots. Values of v are indicated by the intensity of blue color (the darker the blue is, the higher the v is): v = [0, 2, 3.1, 4, 6] (i), v = [0, 0.5, 1, 2, 3] (ii), and v = [0, 0.5, 1, 2, 3] (iii). The trough and peak of x(t) are marked by the dashed and solid lines, respectively. (D) The time delay between S(t) and x(t) as a function of the signal strength v for different values of k1 and k2. Three values of k2 are considered: 0.1 (i), 1 (ii), and 10 (iii). In each panel, k1 is changed from 10−1 to 100.5, shown in different colors and markers. The stars in each panel indicate the parameters used in (C). The time delay has been proven to have only two values when the activation strength v is increased while keeping other kinetic parameters fixed (see Simple ODE model subsection in Methods for details), and thus the fluctuations in the plot of time delay versus v come from numerical errors.

