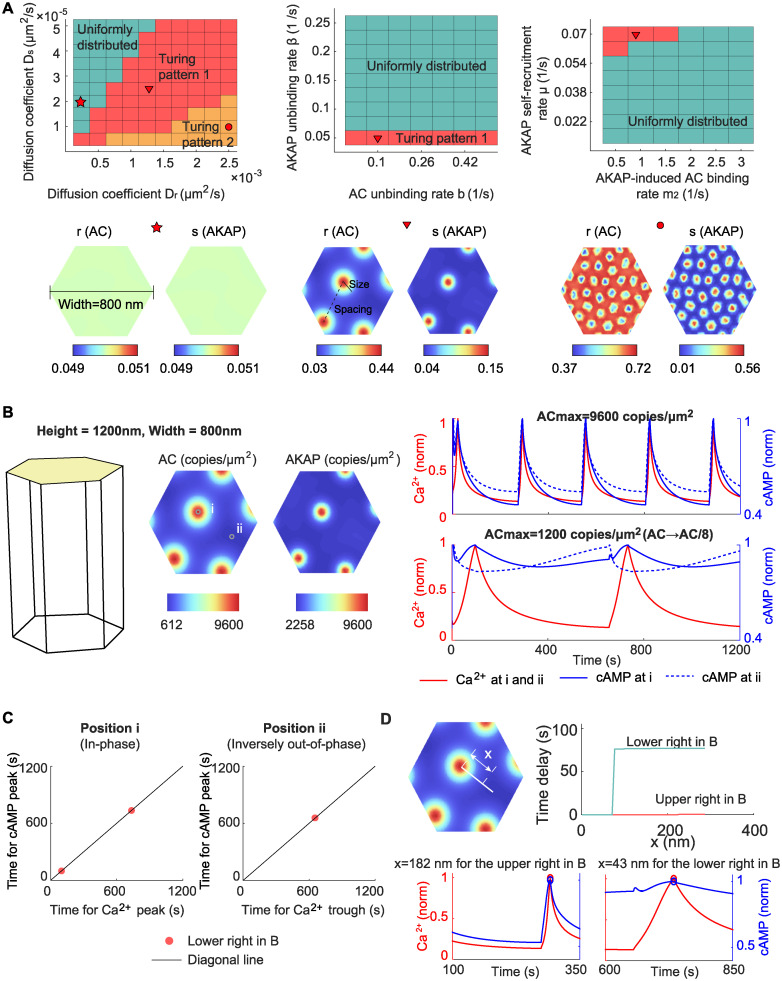
Fig 7. AKAP/AC nanodomain formation can be explained by Turing patterns.
(A) The phase diagram of Turing pattern for parameters vr and vs (upper left panel), β and b (upper middle panel), and m2 and μ (upper right panel). Three patterns occur in the parameter space: the first is that the AC (denoted by r) and AKAP (denoted by s) are uniformly distributed; the second is the Turing pattern where the AKAP and AC are co-localized, which is denoted as Turing pattern 1; the third is also a Turing pattern but the AC level is high outside the AKAP cluster, which is referred to as Turing pattern 2. Typical distributions of AC and AKAP for these three types of pattern are shown in lower panels. The marker over the plot indicates the value of Dr, Ds, β, b, m2 and μ. (B) The dynamics of Ca2+ and cAMP on (i) or outside AKAP/AC nanodomains (ii) when initial conditions of AC and AKAP are re-scaled from the lower middle panel in (A). When the maximal concentration of AC is same as that in Fig 6, the cAMP oscillates in phase with Ca2+ on and outside AKAP/AC nanodomains (upper right panel); when the AC level is one eighth of that in Fig 6, the cAMP oscillates in phase with Ca2+ on AKAP/AC nanodomains but out of phase with Ca2+ outside AKAP/AC nanodomains (lower right panel). (C) The in-phase and inversely out-of-phase oscillations in (B). (D) The time delay in (B) as a function of the distance x to the center of AKAP/AC nanodomains.

