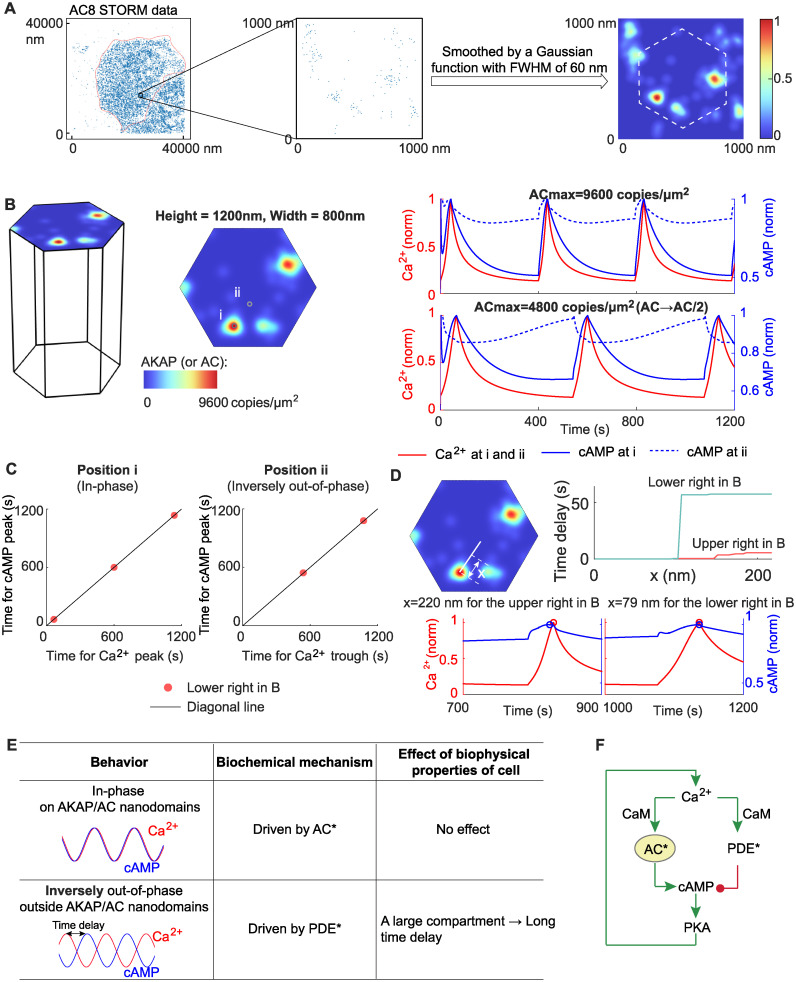
Fig 8. Prediction of the time delay from a realistic distribution of AKAP/AC nanodomains.
(A) Extraction of AC8 data from STORM image. The AC8 STORM data (left panel) is from [32], where the red dashed line indicates the boundary of a single cell. We selected an area with 1000 nm length and 10000 nm width (middle panel), then smoothed the STORM data in this small area by a Gaussian function with FWHM (full width at half maximum) of 60 nm, and finally obtained a smooth distribution of AC8 on the small area (right panel). We chose a hexagon indicated by the white dashed line as the distribution of AC in the following simulations. (B) The dynamics of Ca2+ and cAMP on the AKAP/AC nanodomain (i) and outside the AKAP/AC nanodomain (ii) when the initial distribution of AC is from (A). The initial distribution of AKAP is set to be the same as that of AC. Two cases are studied: the AC has the same maximal values as before (i.e., 9600 copies/μm2) (upper right panel); the AC level is halved (lower right panel). (C) The in-phase and inversely out-of-phase oscillations in the lower right panel in (B). (D) The time delay as a function of the distance to the AKAP/AC nanodomain. (E) Summary of Ca2+-cAMP oscillation, underlying biochemical mechanisms, and the effect of the biophysical properties of the cell. (F) The core motif of the Ca2+/cAMP circuit—incoherent feedforward loop from Ca2+ to cAMP and the feedback from cAMP to Ca2+.

