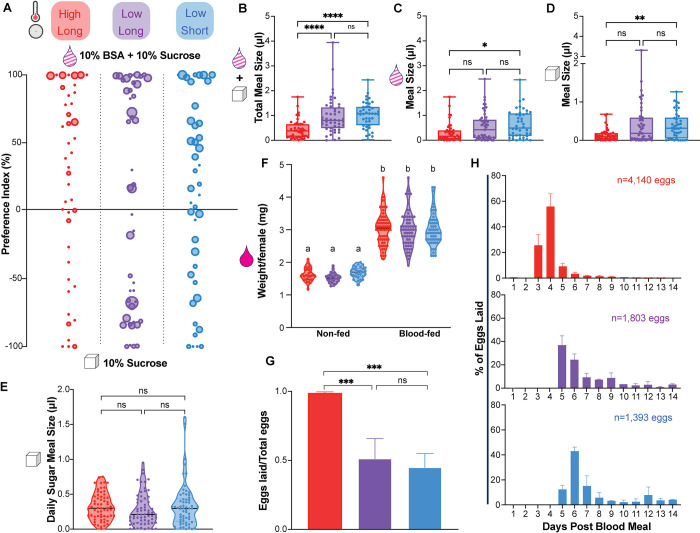
Fig 2. Temperature impacts meal size in a 2-choice assay and egg retention.
A) Two-choice assay to measure preference for “no protein” sugar meal (10% sucrose; bottom) versus “protein rich” meal (10% sucrose + 10% BSA; top) using fluorescent dyes to distinguish between meals. Dot size represents total meal size in μL of an individual female and preference index was calculated as (% “BSA+Sucrose” meal—% “Sucrose only” meal). n = 6 experimental replicates, 4–14 females per replicate. Each experimental replicate is from an independently-reared cohort with matched groups for each condition. B-D) Meal size for B) combined “sucrose” and “BSA + sucrose” meals; C) “BSA + sucrose” meal only; D) “sucrose” meal only. Data is shown as median with range (n = 6 experimental replicates, 4–14 females per replicate; Kruskal-Wallis with Dunn’s multiple comparisons test; * = p < 0.05, ** = p < 0.01, *** = p < 0.001, **** = p < 0.0001). E) Sugar meal size in a “no choice” assay. Data is shown as median with range (n = 4–5 experimental replicates, 7–16 females per replicate; Kruskal-Wallis with Dunn’s multiple comparisons test, n.s. = p > 0.05. F) Quantification of body weight per female before and after blood feeding in “no choice” assay. Data is shown as median with range (n = 2 experimental replicates, 14–33 measurements per replicate; Kruskal-Wallis with Dunn’s multiple comparisons test; letters indicate statistically distinct groups p < 0.05). G) Number of eggs laid/total eggs produced per female. Data is shown as mean with SEM (n = 2–5 experimental replicates; n = 13–28 females per replicate; one-way ANOVA with Tukey’s multiple comparisons test; *** = p < 0.001). H) Daily oviposition measured for days 1–14 post blood meal (n = 2 experimental replicates; 21–28 females per replicate).

