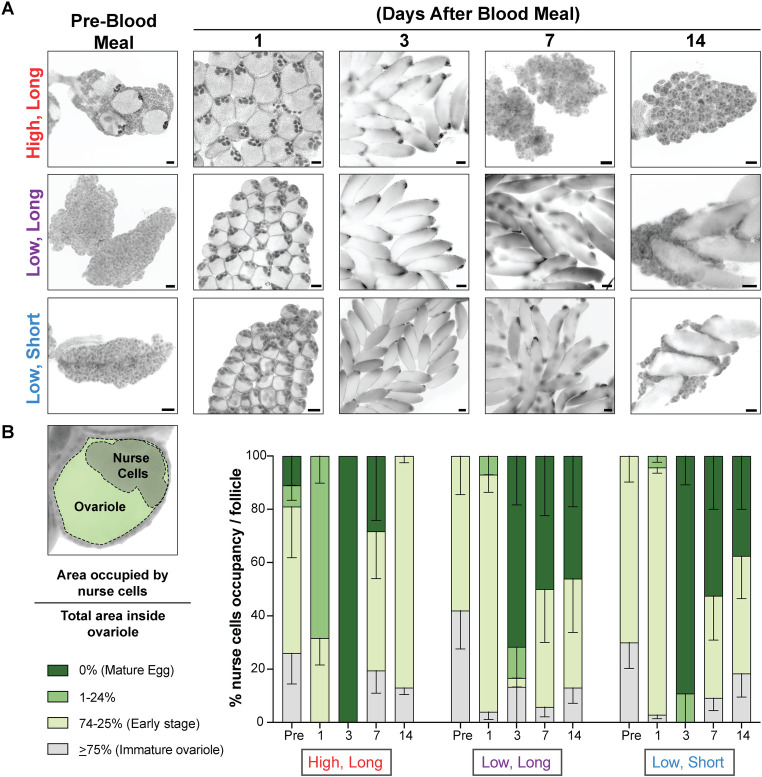
Fig 3. Temperature impacts oocyte heterogeneity before blood feeding.
A) Representative images of ovarioles from females at pre-blood meal, and 1, 3, 7, and 14 days after a blood meal housed in the conditions indicated. B) Left diagram shows an example of a primary ovarian follicle. Ovarian development was measured by calculating the percentage of the follicle (green) occupied by the nurse cells (gray). As the follicle matures into an egg, the percentage occupied by the nurse cells decreases. Right graph shows all oocyte developmental stages at each timepoint and environmental conditions. Each timepoint includes measurements from 20–30 ovarioles from 3–7 pairs of ovaries. Data is shown as mean with SEM.

