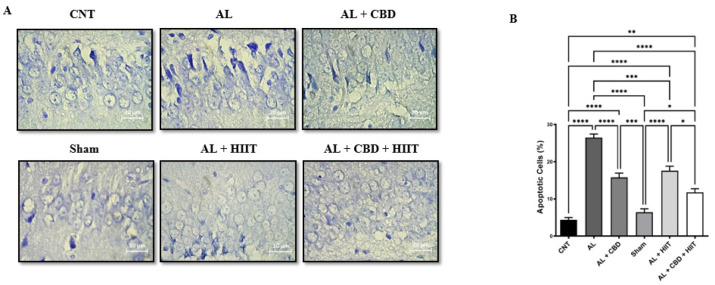
Figure 5.
Evaluation of apoptosis in the hippocampus of Alzheimer’s rats
A) photomicrograph of hippocampus sections after cresyl violet staining (40 × magnification); B) the percentage of apoptotic cells quantified by Image J software. Data are presented as mean ± SEM (n = 3 per group). * P<0.05, ** P<0.01, *** P<0.001, and **** P<0.0001.
AL: Alzheimer’s group; CNT: Control group; HIIT: High-intensity interval training; CBD: Cannabidiol.

