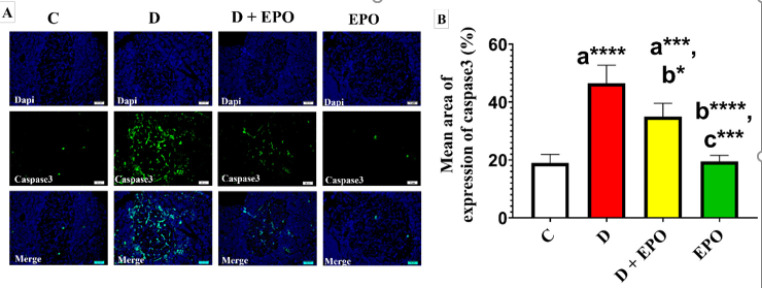
Figure 4.
Effect of EPO on the immunohistochemical expression of anti- caspase-3 antibody in diabetic rats (Immunoperoxidase X400)
(A): Representative fluorescent images of pancreatic tissue sections from the different studied groups showing immunohistochemical detection of Dapi (blue), anti-caspase-3 antibody (green), and merged images of caspase-3 and Dapi (green and red) in islet cells. (B): Quantitative analysis of caspase-3 expression in the islet area. Scale bar, 20 µm. The letters a, b, and c on the bars indicate significant differences when compared with the control, diabetes, and diabetic + EPO rat groups, respectively. *P<0.05,***P<0.001, and ****P<0.0001. C: Control rats; D: Diabetic rats; D + EPO: Diabetic rats given EPO; EPO: Non-diabetic rats subjected to EPO.

