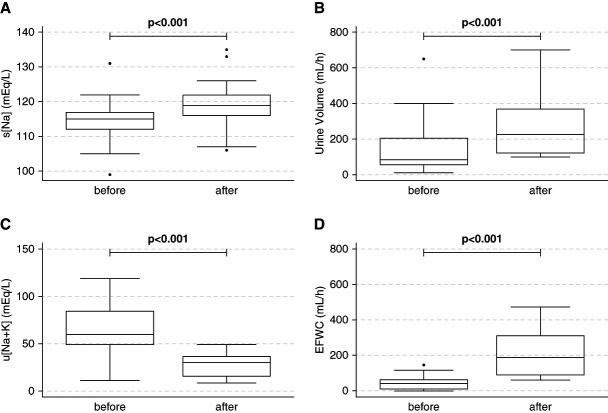
Figure 3.
Comparison of s[Na], UV, u[Na+K], and EFWC before and after water diuresis. Box plots illustrating the data distributions of s[Na] (A), UV (B), u[Na+K] (C), and EFWC (D) before and after water diuresis are shown. Each plot displays the median, IQRs (25th and 75th percentiles), and minimum and maximum observations for each variable. Outliers are depicted as individual dots. The Wilcoxon signed-rank sum test confirmed significant changes in all four metrics after the manifestation of water diuresis: higher s[Na], UV, and EFWC and lower u[Na+K] (all P < 0.001). IQR, interquartile range.

