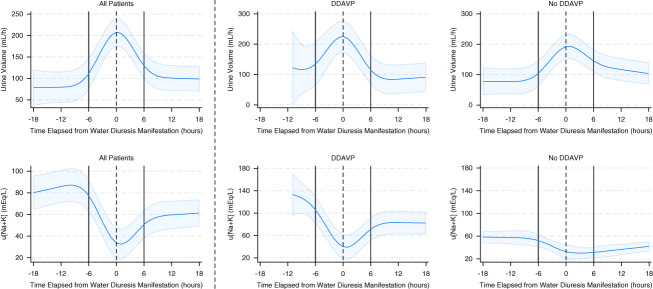
Figure 6.
Changes in UV and u[Na+K] over time based on the administration of DDAVP in patients who experienced water diuresis. A restricted cubic spline model was used to depict the changes in UV and u[Na+K] in all patients, patients administered DDAVP, and patients who were not administered DDAVP. The solid curve represents the predicted trajectory of these measurements, and the shaded area denotes the 95% confidence interval.

