Figure 4:
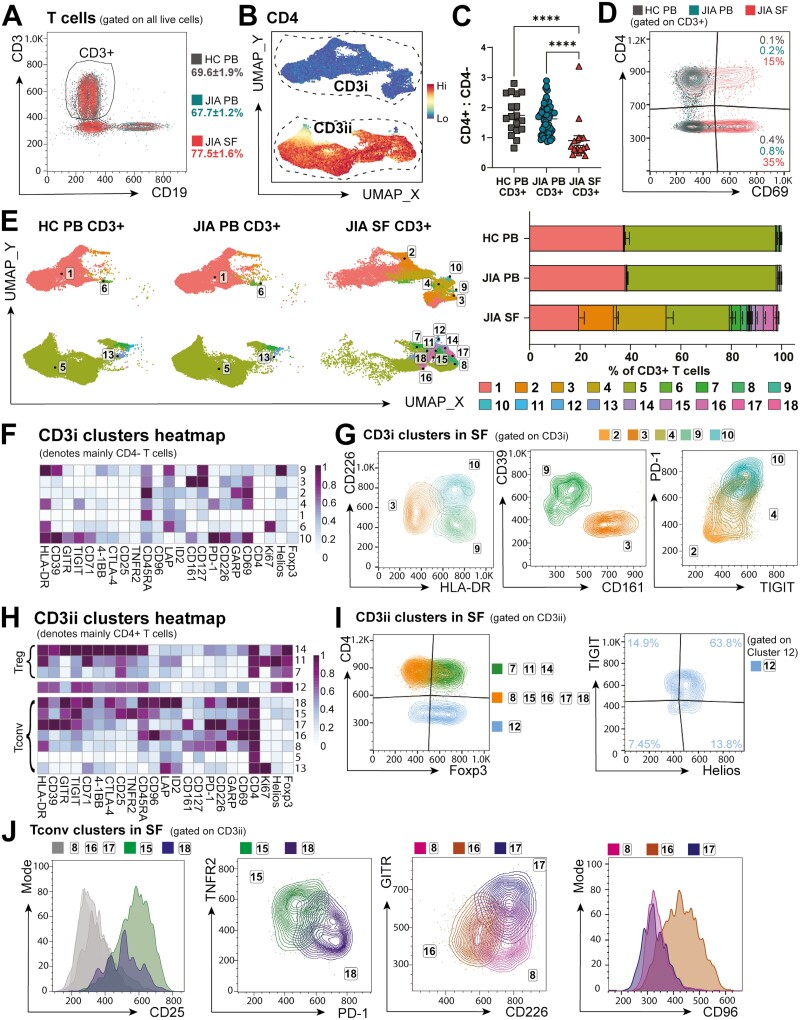
T-cell subsets are highly activated and adapt co-receptor expression in the inflammatory SF microenvironment. CD3+ CD19− cells were sub-clustered with FlowSOM. (A) Gating and frequencies of CD3+ T cells (as % of live cells) in HC PB, JIA PB, and JIA SF. (B) CD3 clusters subclassed into CD3i and CD3ii by CD4 expression UMAP. (C) Ratio of CD4+ to CD4− T cells (as % of CD3+) in HC PB, JIA PB, and JIA SF. (D) Flow plot of CD69 expression across HC PB, JIA PB, and JIA SF CD3+ T cells. (E) Left: UMAP, right: frequencies (as % of CD3+ T cells) of 18 T-cell clusters in HC PB, JIA PB, and JIA SF. (F) T-cell markers heatmap of CD3i clusters (denoting mainly CD4− T cells), Z-score across columns. (G) Overlay flow plots differentiating CD3i clusters (2, 3, 4, 9, 10) in SF by CD226, HLA-DR, CD39, CD161, PD-1, and TIGIT. (H) T-cell markers heatmap of CD3ii clusters (denoting mainly CD4+ T cells) split into Foxp3+ Treg clusters and FoxP3- Tconv clusters, Z-score across columns. (I–J) Overlay flow plots differentiating CD3ii clusters (7, 8, 11, 12, 14–18) in SF with (I) Foxp3 vs CD4 and cluster 12 phenotype by TIGIT and Helios, and (J) flow plots differentiating CD3ii CD4 + Tconv clusters in SF with CD25, TNFR2, PD-1, GITR, CD226, and CD96. Throughout: JIA SF (n = 18), JIA PB (n = 52), HC PB (n = 18). Data with mean ± SEM, one-way ANOVA with Tukey’s multiple comparison testing, ****P < 0.0001

