Figure 5:
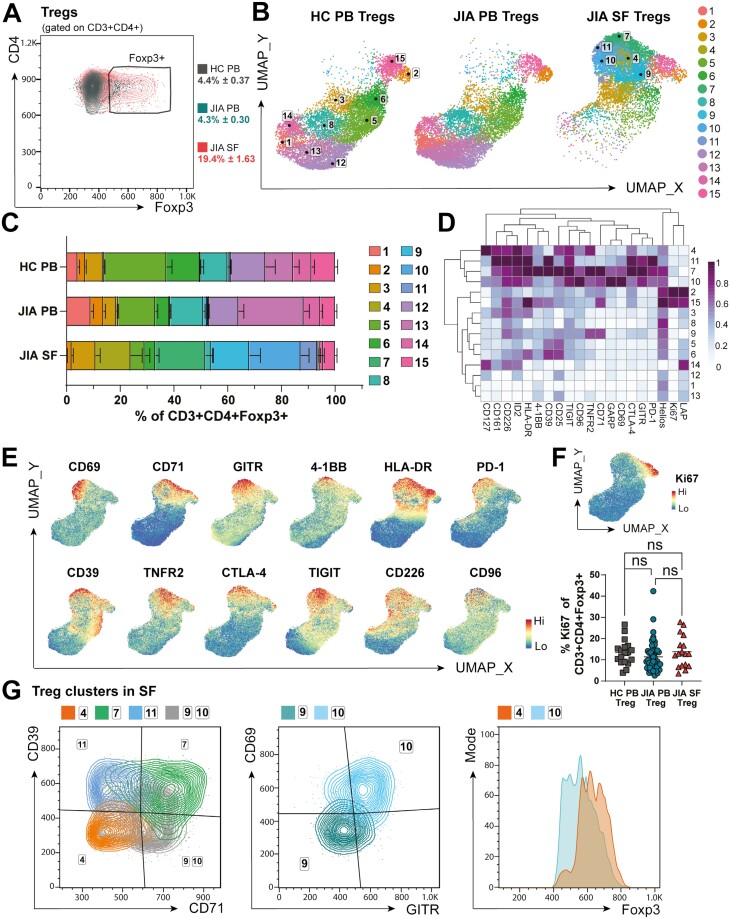
Regulatory T-cell fitness may be altered in the inflamed JIA joint. CD3+ CD4+ Foxp3+ Tregs were sub-clustered using PhenoGraph. (A) Gating strategy with Foxp3+ frequency (as % of CD3+ CD4+) in HC PB, JIA PB, and JIA SF. (B) UMAP with (C) respective frequencies (as % of CD3+ CD4+ Foxp3+) of 15 Treg clusters in HC PB, JIA PB, and JIA SF. (D) Heatmap of 20 relevant Treg markers used for clustering, Z-score across columns. (E) UMAP of combined HC PB, JIA PB, and SF PB Tregs with heatmap overlay of expression levels (by MFI) of CD69, CD71, GITR, 4-1BB, HLA-DR, PD-1, CD39, TNFR2, CTLA-4, TIGIT, CD226, CD96 and (F) Ki67 with summary plot for Ki67 frequency (as % of CD3+ CD4+ Foxp3+) in HC PB, JIA PB, and JIA SF. (G) Overlay flow plots differentiating Treg clusters 1, 7, 9–11 in SF using CD39, CD71, CD69, GITR, and Foxp3. Throughout: JIA SF (n = 18), JIA PB (n = 52), HC PB (n = 18). Data with mean ± SEM, one-way ANOVA with Tukey’s multiple comparison testing, ns = not significant

