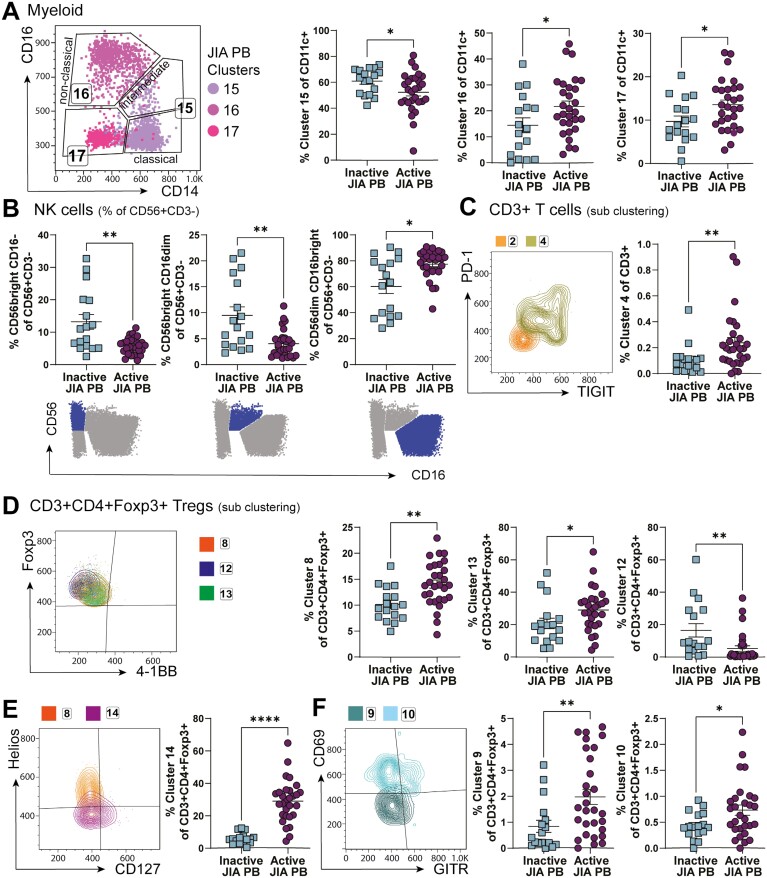
Figure 6:
Unlikely recirculation of SF dominant clusters by assessing PB of active and inactive JIA. Clusters identified by studying JIA SF samples were assessed in clinically active (active joint count, AJC ≥ 1) and clinically inactive (AJC = 0) JIA PB samples, expecting to identify recirculating cells in active but not inactive JIA PB. (A) Gating by CD14 and CD16 with frequency (as % of CD11c+) of myeloid clusters 15–17 in inactive vs active JIA PB. (B) Frequencies (as % of CD56+ CD3−) of NK-cell subsets by traditional gating (CD56 vs CD16, symbolized below) in inactive vs active JIA PB. (C) Overlay flow plot displaying PD-1 and TIGIT expression of clusters 2, 4 from CD3+ T-cell sub-clustering with cluster 4 frequency (as % of CD3+) in inactive vs active JIA. (D–F) Phenotype and frequencies (as % of CD3+ CD4+ Foxp3+ for sub-clustering of CD3+ CD4+ Foxp3+ Tregs) of Treg-specific clusters 8, 13, 12 with Foxp3, 4–1BB (D), 14 with Helios, CD127 (E), and 9, 10 with CD69, GITR (F) in inactive vs active JIA PB. Throughout: JIA PB of clinically inactive (AJC = 0, n = 17) and active (AJC ≥ 1, n = 29). Data with mean ± SEM, Mann–Whitney test, *P < 0.05, **P < 0.01, **** P < 0.0001

