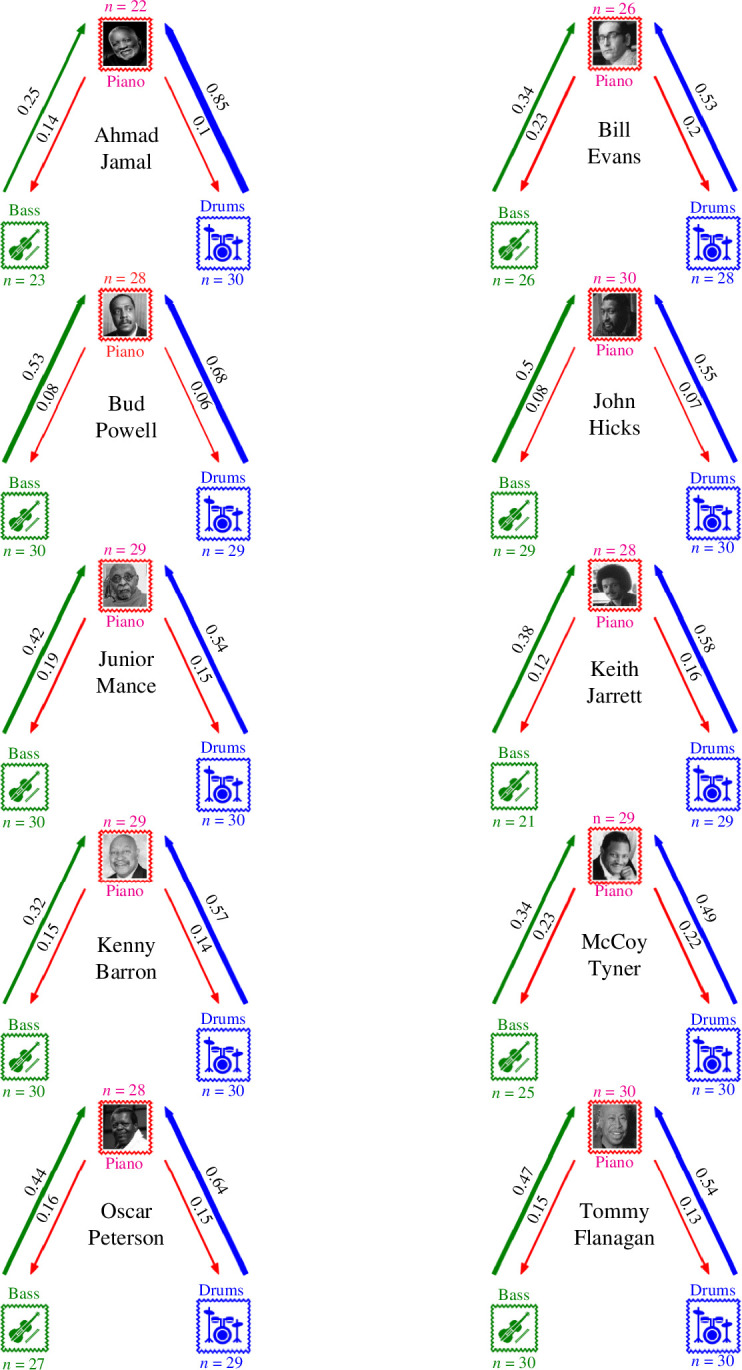
Figure 9.

Modelled coupling networks. Individual plots show the average coupling for ensembles led by each pianist. The direction and degree of the coupling is given by the colour and thickness of the arrows, respectively, insofar as an arrow from the pianist to the bassist indicates how much the bassist adjusted to the pianist. Values above each arrow show the mean coupling coefficient. Values of n indicate the number of models obtained for that performer or role, with the maximum being 30.
