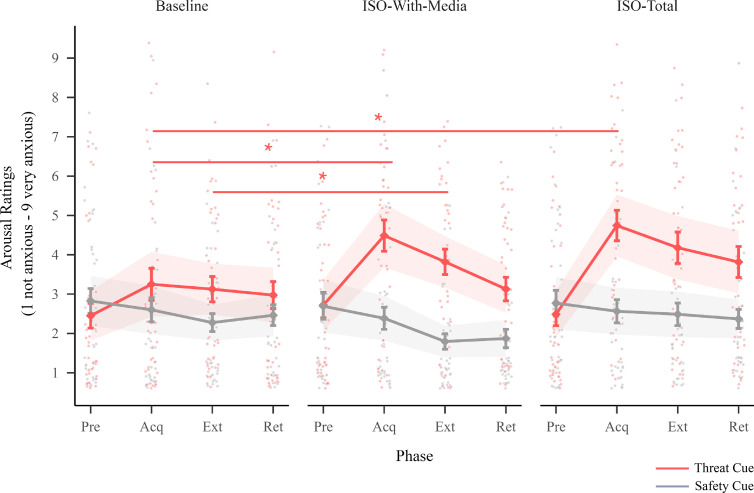
Figure 3.
Arousal ratings. This figure illustrates arousal ratings for the threat and safety cue across sessions (baseline, iso-with-media and iso-total) and phases (Pre = pre-acquisition, Acq = acquisition, Ext = extinction and Ret = retention). Points indicate individual participant responses, diamonds indicate the estimated marginal means, bars indicate standard errors of the estimated marginal means and ribbons indicate the 95% CIs around the estimated marginal means. Lines (with stars) indicate a significant difference in post hoc pairwise comparisons (contrasting session effects for each cue at each phase; Bonferroni corrected for multiple comparisons (adjusted alpha = 0.005); see the electronic supplementary material, tables A8–A10 and A12–A14 for the full list of post hoc comparisons).

