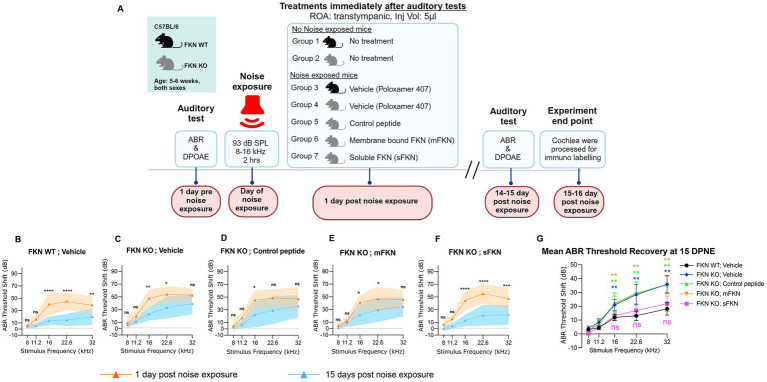
Figure 1.
ABR threshold shifts at 1 DPNE and 15 DPNE. (A) Study design created with BioRender.com. ROA, Route of Administration. (B–F) ABR threshold shifts at 1-day post-noise exposure (DPNE) and 15 DPNE after 2 h at 93 dB SPL at 8–16 kHz octave band noise in (B) FKN WT mice treated with vehicle (N = 8), and in FKN KO mice treated with (C) vehicle (N = 6) (D) control peptide (N = 7) (E) membrane-bound FKN peptide (mFKN) (N = 9) and (F) soluble FKN peptide (sFKN) (N = 8). Dashed line represents threshold shifts prior to noise exposure (baseline). Values are means ± SD. *p < 0.05, **p < 0.01, ***p < 0.001, ****p < 0.0001, and ns, non-significant at respective stimulus frequency. *Represents comparison between 1 DPNE and 15 DPNE, two-way ANOVA, Sidak’s multiple comparisons. (G) Mean ABR threshold shift recovery at 15 DPNE of all the experimental groups. Values are means ± SD. **p < 0.01 and ns, non-significant at respective stimulus frequency. *Represents comparison between FKN WT; vehicle (black circle) versus all other treatment groups, two-way ANOVA, Dunnett’s multiple comparisons.

