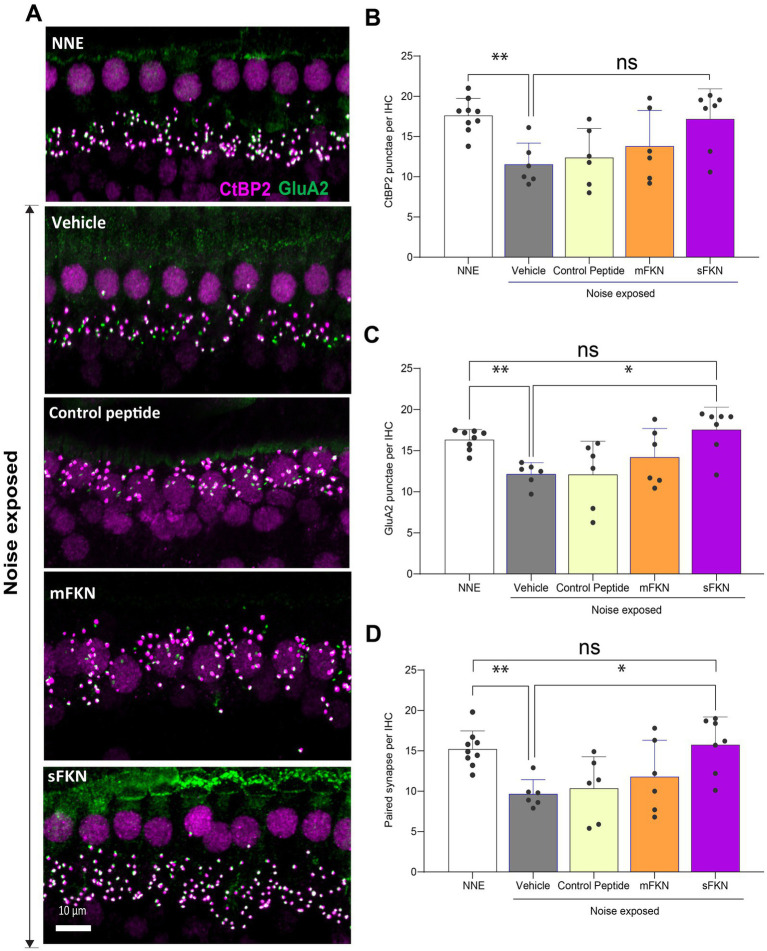
Figure 3.
Inner hair cell ribbon synapses in basal cochlear region of FKN KO mice. (A) Representative micrographs showing IHC-paired ribbon synapses in the basal cochlear region after 15 days of synaptopathic noise exposure. (B) CtBP2 puncta per IHC. (C) GluA2 puncta per IHC. (D) Paired ribbon synapses per IHC. Values are mean ± SD. Each dot in the graphs represents one mouse. Three confocal images were captured from the basal cochlear region per mouse. CtBP2 puncta, GluA2 puncta, and paired synapses per IHC were averaged across the three images per mouse and plotted. **p < 0.01 between no noise-exposed (NNE) vs. noise-exposed vehicle-treated FKN WT and FKN KO mice; *p < 0.05 between noise-exposed FKN KO mice treated with vehicle or sFKN peptide; ns: non-significant between NNE and NE sFKN-treated FKN KO mice. One-way ANOVA, Dunnett’s multiple comparison test. N = 5–9 mice per experimental group.

