Figure 4.
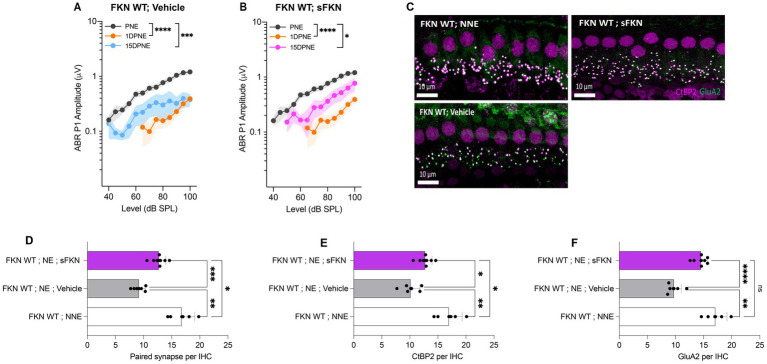
ABR peak I amplitude and IHC ribbon synapse density in FKN WT mice. (A) ABR peak I amplitude at 32 kHz at pre-noise exposure (PNE), 1 DPNE, and 15 DPNE in FKN WT mice treated with vehicle. (B) ABR peak I amplitude at 32 kHz at pre-noise exposure (PNE), 1 DPNE, and 15 DPNE in FKN WT mice treated with a single dose of sFKN peptide. N = 15 mice (PNE and 1 DPNE), N = 8 mice (15 DPNE) in A and B. (C) Representative micrographs showing IHC ribbon synapses from basal cochlear region at 15 DPNE. (D) Paired ribbon synapses per IHC. (E) CtBP2 puncta per IHC. (F) GluA2 puncta per IHC. Values are means ± SD. N = 5–8 mice per experimental group. Each dot in graphs (D–F) represents one mouse. *p < 0.05, **p < 0.01, ***p < 0.001, ****p < 0.0001, and ns, non-significant. One-way ANOVA, Tukey’s multiple comparison test.

