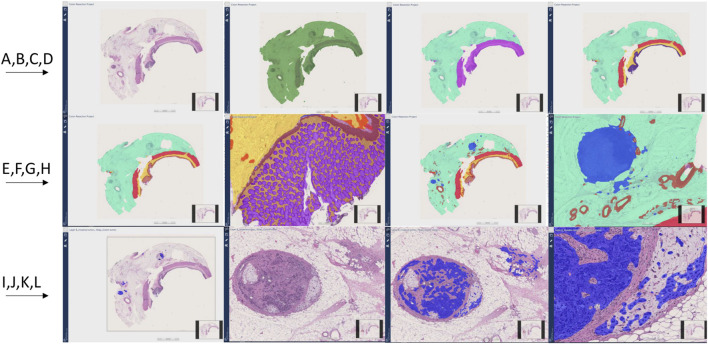
FIGURE 6.
Colon resection project steps and image Analysis results (A–J). First row from left to right (A–D), Second row from left to right (E–H), Third row from left to right (I–L). (A): Original whole slide image H&E stain (×20 magnification), (B): Tissue detection (Green) (C): Light and dark tissue detection [Light tissue (Subserosa and serosa): Light green, Dark tissue (muscular propria, submucosa, and mucosa): Purple] (D): Subserosa and serosa (green), muscularis propria (red), submucosa (yellow), mucosa (purple) detection (E, F): Mucosa subregions detection: Epithelium (Purple), Lamina propria (Yellow), muscularis mucosa (Brown) (G, H): Vessel and lymph node detection (Red: Vessels, Blue: Lymph nodes) (I): Invasive tumor detection (Blue) (J): Metastatic lymph node and tumor focus in subserosa H&E, (K, L): Invasive tumor detection (Blue) in metastatic lymph node and serosal fat tissue.

