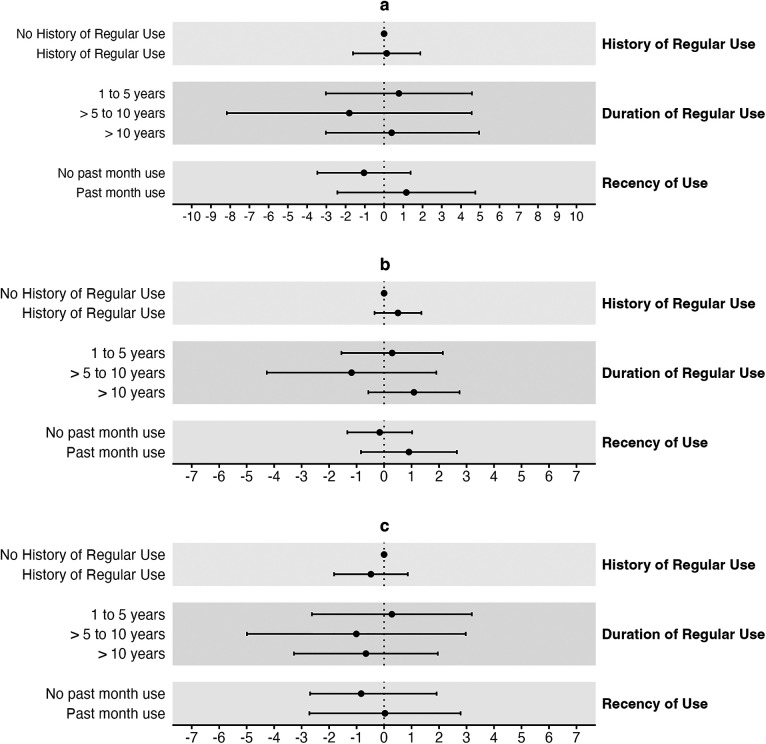
Figure 2.
Adjusted mean differences for blood pressure by cannabis smoking status. (a) Adjusted mean differences and 95% CIs for SBP (mmHg) by cannabis smoking status. (b) DBP (mmHg). (c) PP (mmHg). Each grey band represents a separate model with a unique exposure variable, but identical covariates and outcome variable. All comparisons are made to individuals with no history of regular cannabis smoking. Cls: confidence intervals.

