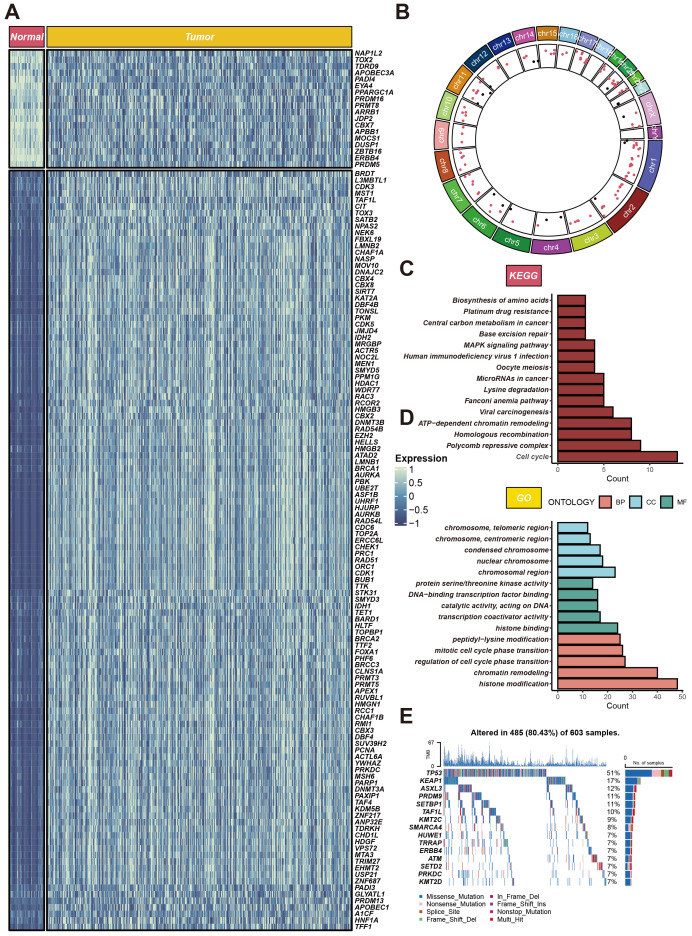
Figure 1.
Expression profiles of CRs in LUAD. (A) Heatmap of differentially expressed CRs between cancerous and adjacent tissues in LUAD patients. (B) Circular plot of genomic variations. The circular plot illustrates gene variations across different chromosomes. (C, D) Gene function enrichment analysis. The upper part shows KEGG pathway analysis results, highlighting the main pathways enriched for CRs. (E) Gene mutation profile. It shows the mutation types and frequencies of CRs in 603 LUAD samples.

