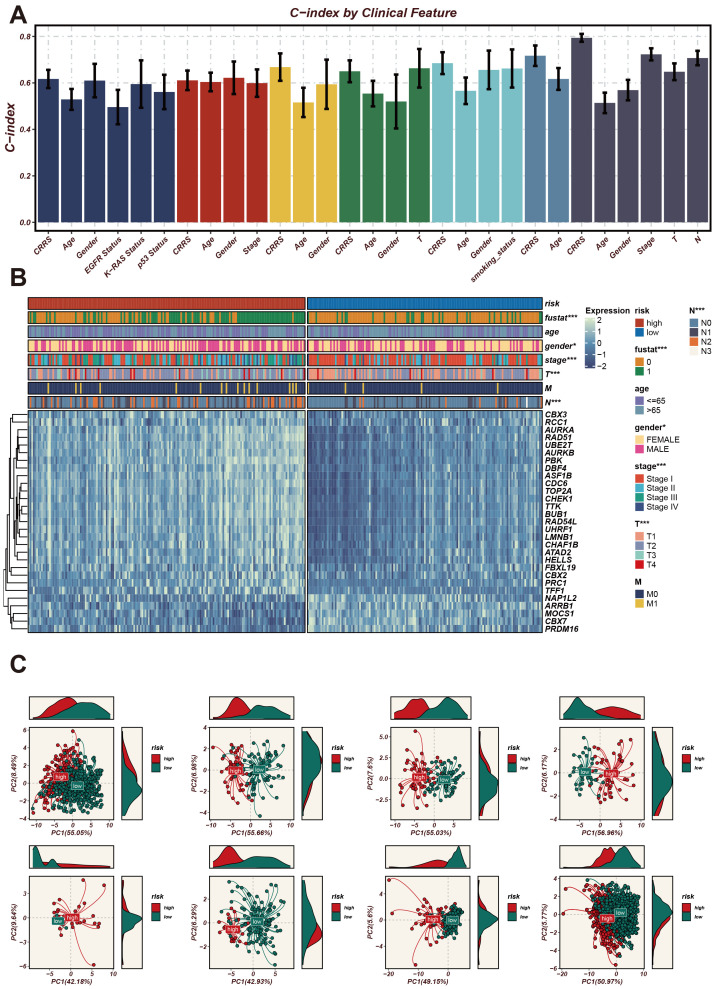
Figure 4.
Expression patterns of CRRS under different clinical characteristics and their impact on the model’s predictive ability. (A) A bar chart of the C-index for clinical characteristics. The horizontal axis represents different clinical characteristics, and the vertical axis represents C-index values, which are used to assess the accuracy of the model’s predictive ability. (B) Heatmap of CRRS expression in high- and low-risk groups with clinical characteristics annotations. The heatmap shows the expression levels of CRRS genes across different samples. The annotation bar at the top indicates the clinical characteristics of the samples, including risk level, age, gender, stage, T stage, and M stage. (C) Principal Component Analysis (PCA) scatter plot. It shows the distribution of high-risk and low-risk group samples on the first two principal components (PC1 and PC2). *p < 0.05, ***p < 0.001.

