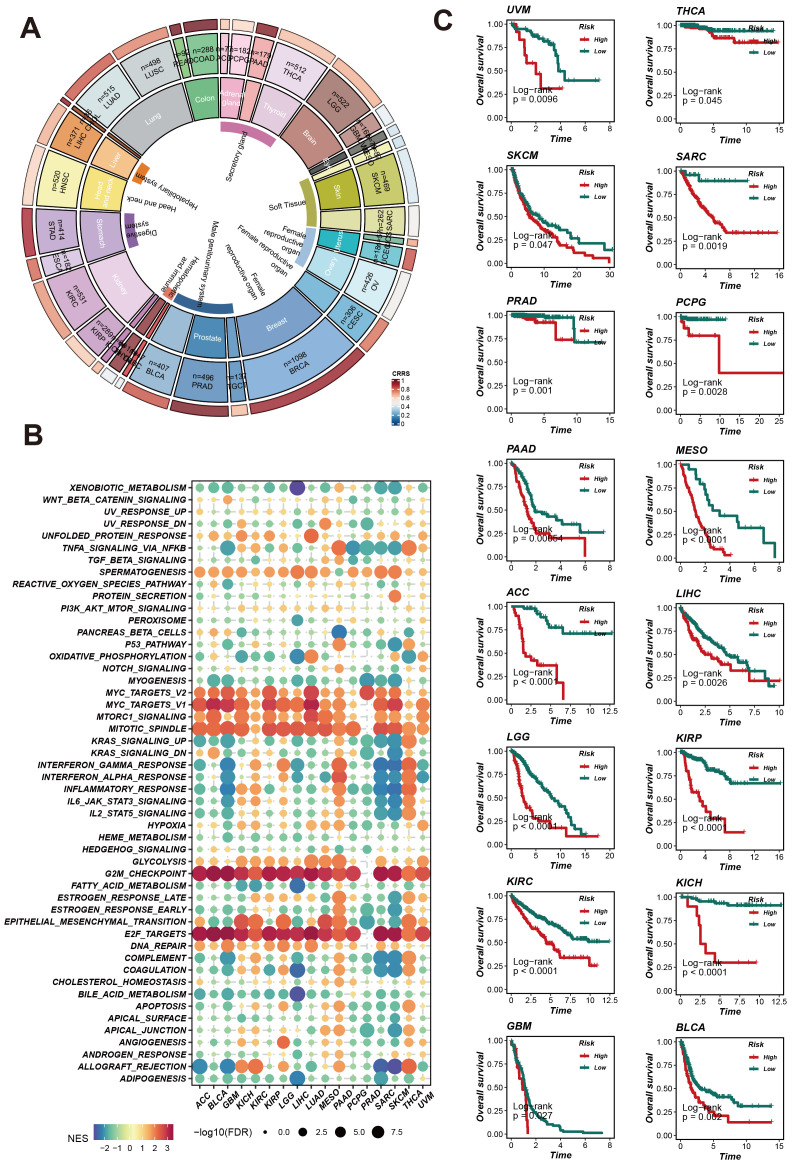
Figure 5.
CRRS predicts pan-cancer patient survival and impacts potential biological pathways. (A) Pan-cancer CRRS Score Circle Plot: The circular plot illustrates the CRRS scores across different cancer types. (B) Pan-cancer Gene Set Enrichment Analysis (GSEA) Bubble Plot. (C) Survival Analysis Curves for Different Cancer Types: Kaplan-Meier curves display the overall survival rates of patients in high-risk and low-risk groups.

