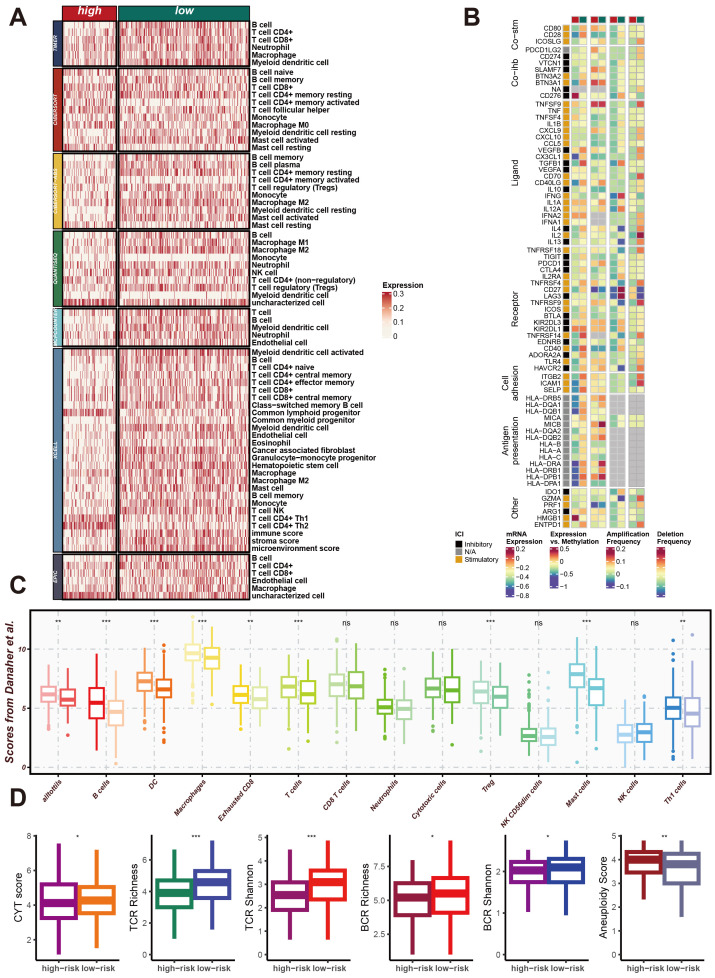
Figure 6.
CRRS involvement in impacting the immune microenvironment of LUAD. (A) Heatmap of Differential Immune Cell Infiltration. This heatmap shows the expression levels of different immune cell types in high-risk and low-risk group samples. Immune cell types listed include T cells, B cells, macrophages, dendritic cells, and others. (B) Heatmap of Immune-Related Gene Expression. This heatmap displays the expression levels of immune-related genes in high-risk and low-risk group samples, including core cell surface molecules (Core-fab), ligands, receptors, cell antigens, and others. (C) Box Plot of Immune Scores. This box plot shows the distribution of various immune scores in high-risk and low-risk groups, including the immune score, stroma score, and microenvironment score. (D) Box Plot of Immune Diversity Scores. This box plot shows the distribution of various immune diversity scores in high-risk and low-risk group samples, including CYT score, TCR richness, TCR diversity (TCR Shannon), BCR richness, BCR diversity (BCR Shannon), and aneuploidy score. *p < 0.05, **p < 0.01, ***p < 0.001.

