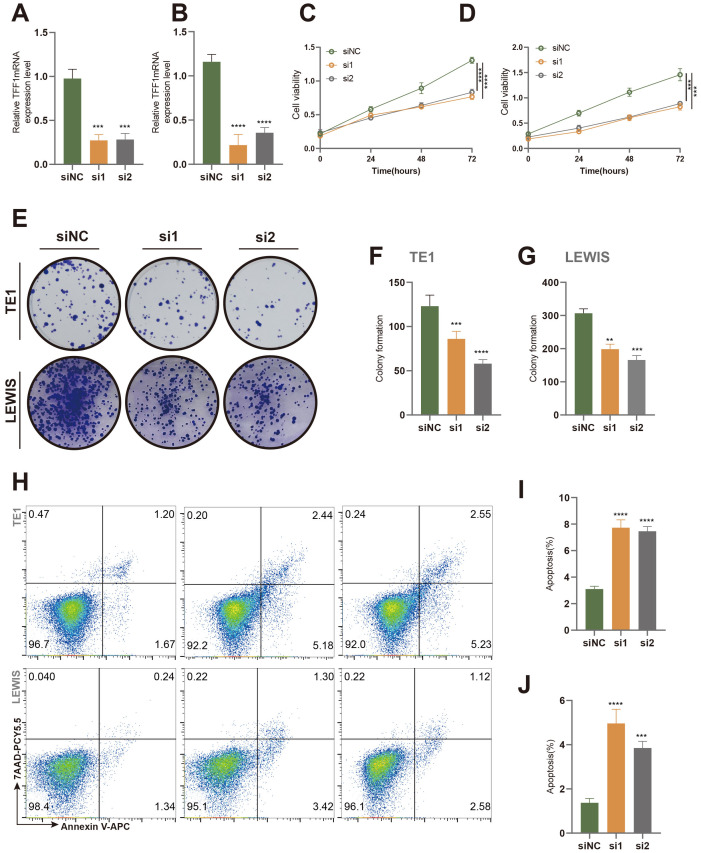
Figure 8.
Effects of TFF1 knockdown on proliferation and apoptosis in TE1 and Lewis cell lines. (A, B) Relative TFF1 mRNA expression levels in TE1 (A) and Lewis (B) cell lines were measured by qRT-PCR after knockdown with two different siRNAs (si1 and si2), with siNC as the negative control. (C, D) Cell proliferation in TE1 (C) and Lewis (D) cells was assessed using the CCK-8 assay. (E) Colony formation assay showed a significant reduction in colony-forming ability in TE1 and Lewis cells after TFF1 knockdown. (F, G) Quantification of colony numbers in TE1 (F) and Lewis (G) cells. (H) Flow cytometry analysis of apoptosis in TE1 and Lewis cells stained with Annexin V-FITC and 7-AAD. (I, J) Quantification of the percentage of apoptotic cells in TE1 (I) and Lewis (J) cells. Data are presented as mean ± standard deviation. **p < 0.01, ***p < 0.001, ****p < 0.0001 indicate statistically significant differences compared to the siNC group.

