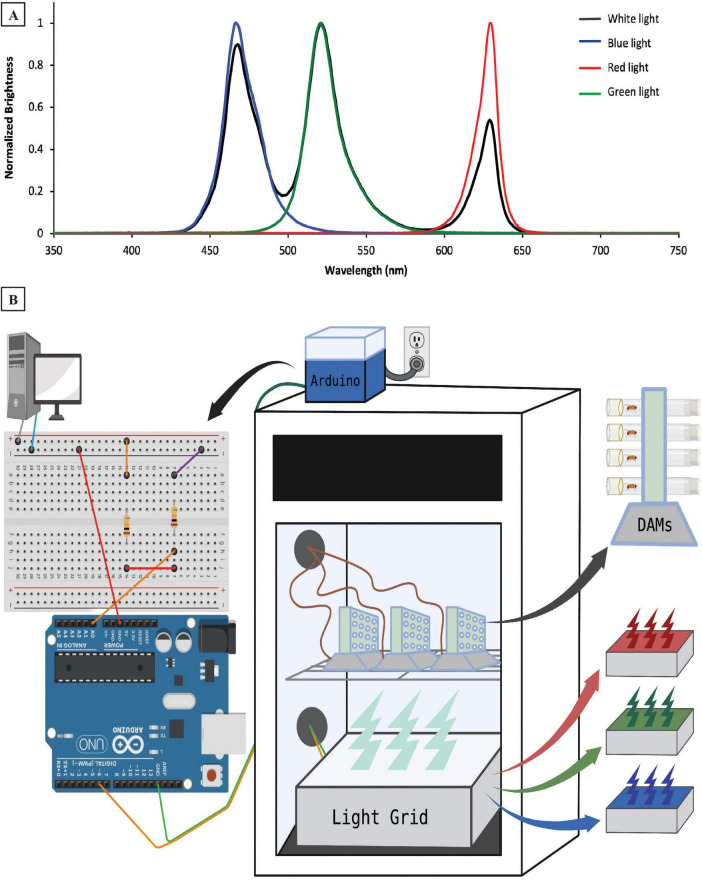
FIGURE 1.
Experimental design and methodology. (A) Emission spectra of four light colors (white, blue, red, and green) used during the experiment. (B) Experimental setup illustrating locations of hardware controlling the light emission, as well as the Drosophila Activity Monitors (DAMs) in and around our sleep testing incubator. The desktop computer sends electrical signals to a circuit that then connects to our Arduino microcontroller (atop the incubator), which is wired to the light grid (inside the incubator). The light grid—which contains red, green, and blue LEDs, is located below the DAMs, which track individual flies’ sleep/wake behavior. The DAMs are wired out of the incubator to provide data to the desktop computer.

