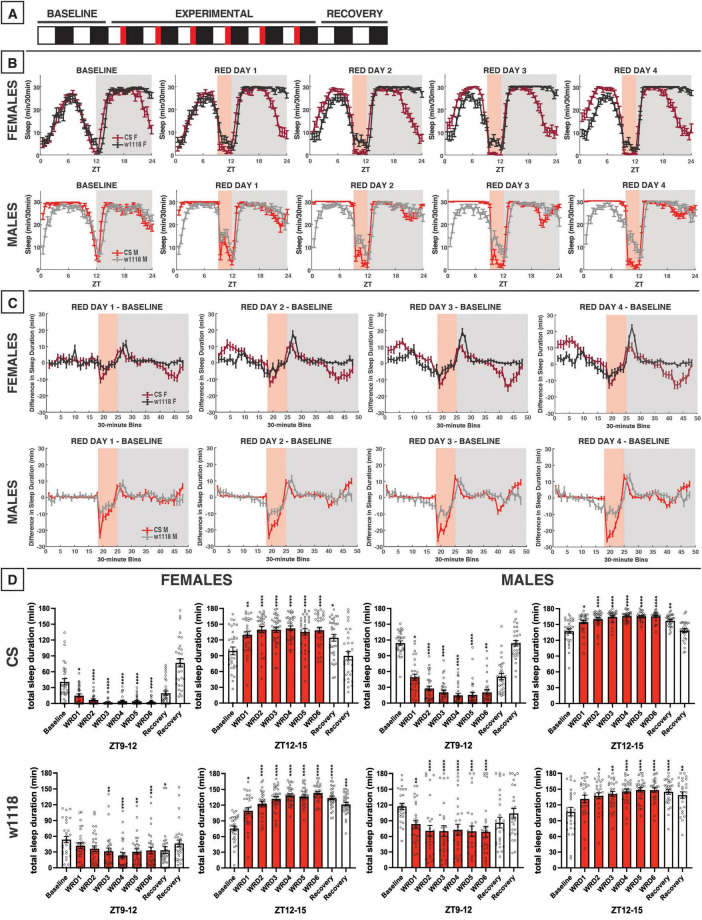
FIGURE 10.
Evening red light for 3 h acutely reduces sleep in both CS and w1118 flies, but stronger effects are observed in CS. (A) Timeline of entire experiment, showing 2 d of baseline 12:12 WD, 6 d experimental 9:3:12 white/red/dark (WRD), 2 d recovery WD. (B) Sleep patterns for male and female CS (red) and w1118 (gray) flies. Sleep (min) during each 30-min bin of the day was averaged across flies for each group and plotted to show overall sleep profiles over the second baseline and first four experimental days. (C) Differences in sleep between experimental days and baseline of male and female CS and w1118. Mean sleep duration (min) in each 30-min bin of the baseline day was subtracted from the mean sleep duration in each respective bin on the first four experimental days. (D) Total sleep duration (min) during red-light exposure (ZT9–12) and immediately after (ZT12–15). Sexes and genotypes were analyzed separately with a repeated-measures ANOVA or nonparametric alternative, followed by post-hoc tests. Asterisks indicates significant difference in sleep during 3-h bin (per post-hoc test) within group between experimental/recovery and baseline day (*P < 0.05, **P < 0.01, ***P < 0.001, ****P < 0.0001). Ns were 32, 31, 30, 28 for CS female, w1118 female, CS male, w1118 male, respectively.

