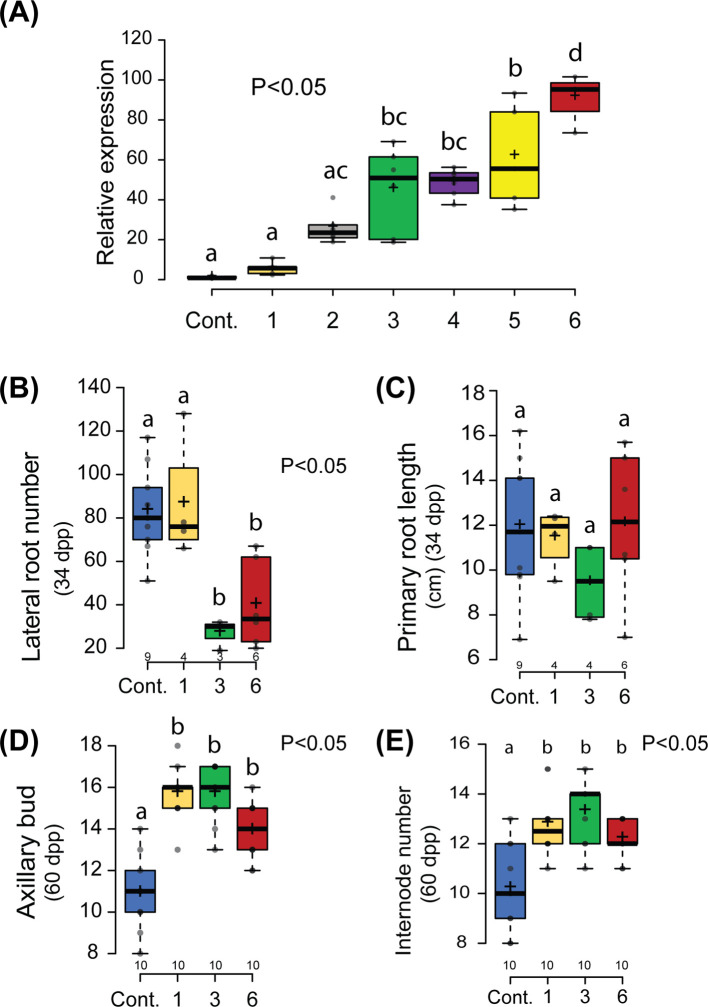
Figure 1.
Non-symbiotic phenotype of Parasponia mNSP2ox lines. (A) Relative expression of NSP2 in root tissue of 6 independent lines compared to an empty vector control line (Cont.). mNSP2ox lines 1 to 3 contain the transgene construct pLjUBQ1:mPanNSP2intron, whereas lines 4 to 6 carry pLjUBQ1:mNSP2. Expression was measured using qPCR (n=3). (B, C) Quantification of the number of lateral roots (B) and primary root length (C) of control and transgenic lines 1,3, and 6 in vitro grown 34 days post planting (dpp). (D, E) Quantification of number of lateral shoot branching (D) and internode (E) of mNSP2ox lines 1, 3, and 6 at 60 days post planting (dpp). Different letters indicate significant differences (p<0.05) between these lines as determined by One-way ANOVA in combination with Tukey’s post hoc test). All data are displayed in box plots, showing data points, the median, and the interquartile range (IQR).

