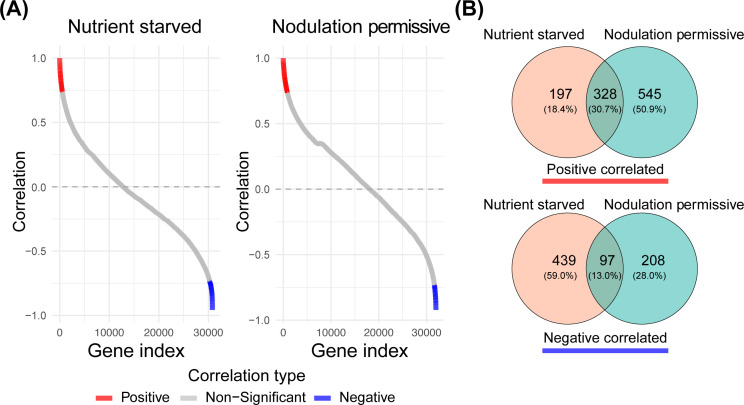
Figure 3.
Pearson correlation of all Parasponia genes versus NSP2 profiles under arbuscular mycorrhizal and nodulation permissive nutrient conditions. (A) Pearson correlation coefficients are sorted in ascending order. Genes that are significantly positively correlated are colored in red, while negatively correlated genes are colored in blue. (Benjamini-Hochberg adjusted p-value, BH < 0.05) (B) Venn diagrams illustrate the overlap between genes that positively and negatively correlate with NSP2 expression for the two nutrient conditions.

