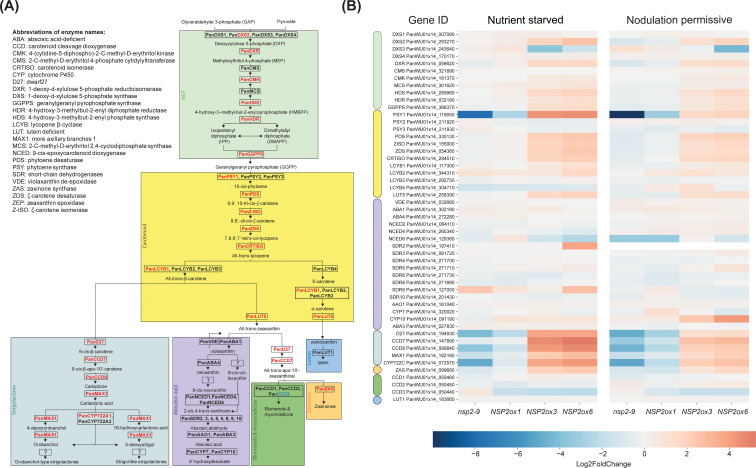
Figure 4.
Schematic representation of the carotenoid biosynthetic pathway in Parasponia and heatmap of differential gene expression in root tissue in Parasponia under nutrient starved mycorrhiza and nodulation permissive conditions. (A) Parasponia genes found to be positively correlated with NSP2 over-expression level are colored in red, while non correlating genes are colored in black. The MEP biosynthetic pathway is shaded with green, the carotenoid biosynthetic pathway is shaded with yellow, the strigolactones biosynthetic pathway is shaded cyan, the ABA biosynthesis pathway is shaded with magenta, the zaxinone biosynthesis is shaded orange, the blumenol and Mycorradicins biosynthesis is shaded green, and the Lutein biosynthesis is shaded light blue. Enzyme names are based on annotations in Arabidopsis thaliana and Parasponia andersonii. Biosynthetic pathway is based on Wakabayashi et al., 2019; Wakabayashi et al., 2020; and Li et al., 2022. (B) Heatmap of gene expression in the carotenoid pathway across different lines: Pannsp2-9 knockout mutant, mNSP2ox1, mNSP2ox3, and mNSP2ox6 ectopic expression lines. Expression levels are indicated by color intensity, with the scale representing log2fold changes. Each row represents a gene from the MEP (green), carotenoid (yellow), ABA (magenta), strigolactone (cyan), zaxinone (orange), blumenols (green, and lutein (blue).

