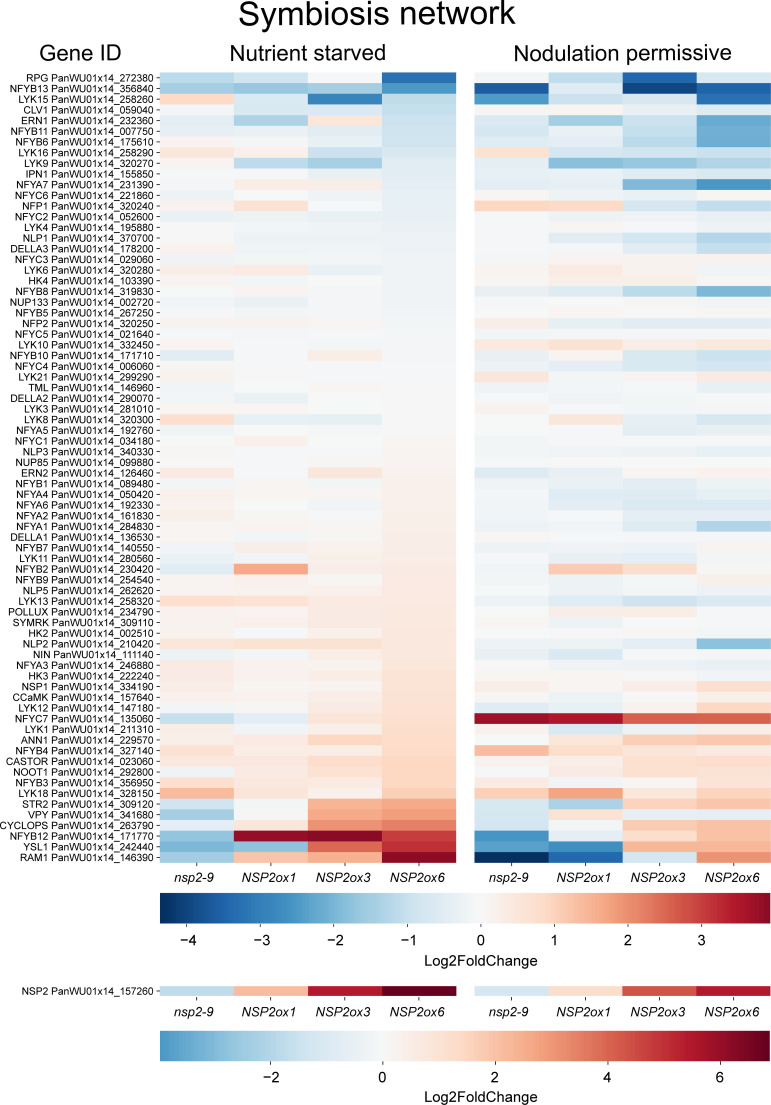
Figure 5.
Heatmap of genes involved in the symbiosis network across different lines: Pannsp2-9 knockout mutant, mNSP2ox1, mNSP2ox3, and mNSP2ox6 ectopic expression lines. Expression levels are indicated by color intensity, with the scale representing Log2fold changes. Each row represents a gene from the symbiosis pathway.

